


7/22/2014 8:34:49 AM
Bears loosen their grip...
Recommendation: Take no action.
Click here to access our stock market chat rooms today! For a limited time, try our chat room for free. No subscription necessary to give it a try.
Stock Market Trends:

- ETF Positions indicated as Green are Long ETF positions and those indicated as Red are short positions.
- The State of the stock market is used to determine how you should trade. A trending market can ignore support and resistance levels and maintain its direction longer than most traders think it will.
- The BIAS is used to determine how aggressive or defensive you should be with an ETF position. If the BIAS is Bullish but the stock market is in a Trading state, you might enter a short trade to take advantage of a reversal off of resistance. The BIAS tells you to exit that ETF trade on "weaker" signals than you might otherwise trade on as the stock market is predisposed to move in the direction of BIAS.
- At Risk is generally neutral represented by "-". When it is "Bullish" or "Bearish" it warns of a potential change in the BIAS.
- The Moving Averages are noted as they are important signposts used by the Chartists community in determining the relative health of the markets.
Best ETFs to buy now (current positions):
Long DIA at $161.48 as of December 19, 2013
Long SPY at $181.19 as of December 19, 2013
Click here to learn more about my services and for our ETF Trend Trading.
Value Portfolio:
Long SDRL at $33.90 on June 15, 2012 (Shares were put to us when options expired. We were paid $1.10 per share when we sold those options and bought shares for $35.00 each.) We have collected dividends: June 10, 2014 $1.00, March 5, 2014 $0.98, December 3, 2013 $0.95, September 5, 2013 $0.91, June 5, 2013 $0.88, $1.70 Dec 4, 2012, $0.84 Sep 4, 2012. Total = $6.28 in dividend payments.
Short FXE at $124.19 on August 24, 2012
Long UUP at $22.43 on August 24, 2012
Short FXE at $134.48 on October 4, 2013
Long SDRL at $35.43 on Feb 18, 2014
Long SDRL at $33.50 on March 21, 2014 (Shares were put to us when options expired. We were paid $1.50 per share when we sold those options and bought the shares for $35.00 each.) We have collected dividends: June 10, 2014 $1.00.
We publish new reports to our free newsletter every month. If you're not a member, sign up by clicking here: Free Stock Market Newsletter
A gap down open was followed by a morning sell-off that never saw the major indexes off by as much as one percent before the bulls, once again, began buying. This left the major indexes and most other equity indexes closing above their 20-, 50-, and 200-Day Moving Averages (DMAs). The Semiconductor Index (SOX 645.02 +1.58) was able to post a modest gain while the Dow Jones Transports (IYT 149.62 -0.47) and the Finance Sector ETF (XLF 22.85 -0.06) posted losses. The three canaries; Russell-2000 (IWM 113.77 -0.46), Bank Index (KBE 32.30 -0.08), and Regional Bank Index (KRE 38.79 -0.16) closed lower remaining in downtrend states and shifting to a NEUTRAL BIAS. All three closed below their 20-, 50-, and 200-DMAs. Longer Term Bonds (TLT 115.09 +0.57) closed fractionally higher but posting a gravestone doji and looking like a top is being put in here. It maintains an uptrend state and a BULLISH BIAS. It remains above its 20-, 50-, and 200-DMAs. Trading volume was light with 541M shares traded on the NYSE. Trading volume on the NASDAQ was also light with 1.553B shares traded.
There were no economic reports of interest released. Instead, geopolitical concerns gave way to growing confidence that the bears did not have what it takes to move markets lower and the "buy the dip" crowd stepped in.
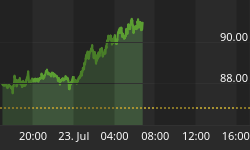
Apple (AAPL 93.94 -0.49) posted a fractional loss. AAPL constitutes about 20 percent of the NASDAQ-100 and nearly five percent of the S&P-500.
Seadrill Limited (SDRL 37.78 +0.28) posted a fractional gain. The next target above remains $40.96, it's closing price on the last trading day of 2013. It is in an trading state. We sold March 2014 $35.00 put contracts for $150 at the open on Feb 18th, 2014 and bought shares at $35.43. The stock is now trading ex-dividend for $0.98 and one dollar for total dividends issued of $1.98. The shares were put to us at $35.00 less the $1.50 per share we were paid for the puts, so we have an effective price of $33.50.
The U.S. dollar and the Euro were almost unchanged.
The yield for the 10-year treasuries fell a single basis point to clos at 2.47. The price of a barrel of crude oil rose +$1.46 to close at $104.59.
The implied volatility for the S&P-500 (VIX 12.81 +0.75) rose six percent. The implied volatility for the NASDAQ-100 (VXN 14.17 +0.77) rose six percent as well.
Market internals were mixed. Decliners led advancers 7:4 on the NYSE and by 5:3 on the NASDAQ. Down volume led up volume 3:2 on the NYSE while up volume edged down volume on the NASDAQ. The index put/call ratio fell -0.05 to close at 1.06. The equity put/call ratio rose +0.06 to close at 0.62.
Conclusion/Commentary
Even though most equities reported losses on the day, the finish was much better than would be expected after the early sell-off. The ability to maintain a key support level on the S&P-500 allowed the "buy the dip" crowd to maintain control. This sets the equities markets to roar higher with a high probability of closing at new all time highs on Tuesday. If that does not occur, then we will re-think our currently held long positions.
We hope you have enjoyed this edition of the McMillan portfolio. You may send comments to mark@stockbarometer.com.


