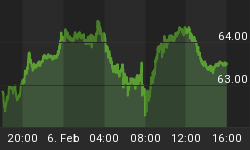
Precious metals drifted lower over the week in quiet trading. The bears took comfort in the lack of a positive price reaction to political news from the Ukraine and Gaza, and from economic surveys released in the US which disappointed analysts looking for signs of economic growth. Even the IMF downgraded its forecasts for the US economy, and the 10-year treasury yield fell back to 2.46%, having rallied up to 2.65% from the May low at 2.41%. This is shown in the chart below.

If the 2.4% level is breached that will be taken by traders as a sign that the US economy is in trouble. Lower Treasury yields are seen as evidence that the market is demoting inflation risk, given the lacklustre performance of the economy. But this is not the whole story: spreads between US Treasuries and corporate debt are widening, which suggests that the favoured safe-haven play is Treasuries and T-Bills rather than gold.
The gold price has come under pressure as a result. It has not helped that the August future is beginning to run off the board, bringing in some natural selling pressure not fully compensated for by demand for the December contract. This can be clearly seen in the next chart, of the gold price and Open Interest, which has contracted by 6,400 contracts over the last two weeks.

Yesterday the China Gold Association reported a drop in gold demand by a fifth in the first six months this year compared with the first half of 2013. These figures presumably only identify retail demand reported to it, because 962.46 tonnes were actually delivered via the Shanghai Gold Exchange, compared with 1,103.60 tonnes in 2013. We do know that China's demand has slackened from the exceptionally high levels of last year, but when one allows for the artificial boost to demand in the wake of the price smash in April 2013, current levels of demand are still healthy. For what it's worth the latest figures for SGE deliveries show 1,029 tonnes delivered this year so far, up 14.15% on last year.
The silver price has suffered a similar fate this week to that of gold, but volume has been extremely low, suggesting that the price is moving on the bank of gold rather than any material business in silver as such. This is shown in our next chart, and it can be seen that Open Interest is holding up a little better than for gold.

Yesterday the gold price was hit at the start of Asian trading and an hour into New York trading a sell order of some 6,000 contracts was dumped on the market, driving the price down to $1288. It was clumsy dealing, which appeared to be designed to drive the price lower, and the effect was magnified because of the quiet market conditions.
In essence, precious metals are in corrective mode with low volumes, and gold has moved back to its 200 day moving average, where it could find some renewed buying support.
Next week
Monday. UK: Nationwide House Prices. US: Pending Home Sales. Japan: Real Household Spending, Unemployment, Retail Sales.
Tuesday. UK: Mortgage Approvals, Net Consumer Credit, Secured Lending, M4 Money Supply. US: S&P Case-Shiller Home Price Index, Consumer Confidence. Japan: Industrial Production.
Wednesday. Eurozone: Business Climate Index, Consumer Sentiment, Industrial Sentiment, Industrial Sentiment. US: ADP Employment Survey, Core PCE Price Index, GDP Annualised, GDP Price Index.
Thursday. Japan: Housing Starts, Construction Orders. Eurozone: Flash HICP, Unemployment. US: Initial Claims, Chicago PMI.
Friday. Japan: Vehicle Sales. Eurozone: Manufacturing PMI. US: Core PCE Price Index, Non-farm Payrolls, Personal Income, Personal Spending, Private payrolls, Unemployment, Construction Spending, ISM Manufacturing Index.


