


8/1/2014 7:53:20 AM
Argentina bond default in the works...
Recommendation: Take no action.
Click here to access our stock market chat rooms today! For a limited time, try our chat room for free. No subscription necessary to give it a try.
Stock Market Trends:

- ETF Positions indicated as Green are Long ETF positions and those indicated as Red are short positions.
- The State of the stock market is used to determine how you should trade. A trending market can ignore support and resistance levels and maintain its direction longer than most traders think it will.
- The BIAS is used to determine how aggressive or defensive you should be with an ETF position. If the BIAS is Bullish but the stock market is in a Trading state, you might enter a short trade to take advantage of a reversal off of resistance. The BIAS tells you to exit that ETF trade on "weaker" signals than you might otherwise trade on as the stock market is predisposed to move in the direction of BIAS.
- At Risk is generally neutral represented by "-". When it is "Bullish" or "Bearish" it warns of a potential change in the BIAS.
- The Moving Averages are noted as they are important signposts used by the Chartists community in determining the relative health of the markets.
Best ETFs to buy now (current positions):
Long DIA at $161.48 as of December 19, 2013
Long SPY at $181.19 as of December 19, 2013
Click here to learn more about my services and for our ETF Trend Trading.
Value Portfolio:
Long SDRL at $33.90 on June 15, 2012 (Shares were put to us when options expired. We were paid $1.10 per share when we sold those options and bought shares for $35.00 each.) We have collected dividends: June 10, 2014 $1.00, March 5, 2014 $0.98, December 3, 2013 $0.95, September 5, 2013 $0.91, June 5, 2013 $0.88, $1.70 Dec 4, 2012, $0.84 Sep 4, 2012. Total = $6.28 in dividend payments.
Short FXE at $124.19 on August 24, 2012
Long UUP at $22.43 on August 24, 2012
Short FXE at $134.48 on October 4, 2013
Long SDRL at $35.43 on Feb 18, 2014
Long SDRL at $33.50 on March 21, 2014 (Shares were put to us when options expired. We were paid $1.50 per share when we sold those options and bought the shares for $35.00 each.) We have collected dividends: June 10, 2014 $1.00.
We publish new reports to our free newsletter every month. If you're not a member, sign up by clicking here: Free Stock Market Newsletter
A large gap down was followed by more selling. The initial gap was less than one percent but by the end of the session, the Dow was down 1.9%, the S&P-500 down 2.0%, and the NASDAQ-100 down 2.1%! The NASDAQ-100 joined the Dow and S&P-500 in downtrend states with the Dow and S&P-500 closing below their 20- and 50-Day Moving Averages (DMAs) and the NASDAQ-100 closing below its 20-DMA. All three remain above their respective 200-DMAs but trading volume was heavy on the Dow and S&P-500 ETFs and above average for the NASDAQ-100 ETF. All three currently maintain a BULLISH BIAS. The Semiconductor Index (SOX 607.54 -13.06) fell more than two percent maintaining its downtrend state and its position below its 20- and 50-DMAs. The Dow Jones Transports (IYT 145.83 -2.42) lost 1.6% closing below its 20- and 50-DMAs and shifting to a downtrend state. The Finance Sector ETF (XLF 22.41 -0.47) fell two percent to close below its 20- and 50-DMAs and shift to a downtrend state. The three canaries all closed mixed: the Russell-2000 (IWM 111.19 -2.60), the Bank Index (KBE 31.96 -0.59), and the Regional Bank Index (KRE 38.43 -0.64) all were tagged hard but the bank indexes closed down less than two percent with the Russell-2000 and Bank Index in downtrend states but the Regional Bank Index remains barely in a trading state. All three maintain a BEARISH BIAS. Longer Term Bonds (TLT 113.98 -0.34) gapped down significantly but finish down just 0.3%. It remains in a trading state closing just above its 20-DMA and above its 50- and 200-DMAs. Trading volume increased to average with 927M shares traded on the NYSE. Trading volume on the NASDAQ increased to moderately heavy with 2.253B shares traded.
There were five economic reports of interest released:
• Challenger Job Cuts (Jul) came in at 24.4% versus June's -20.2%
• Initial Jobless Claims for last week came in at 302K versus an expected 310K
• Continuing Jobless Claims came in at 2.539M versus an expected 2.525M
• Employment Cost Index (Q2) rose +0.7% versus an expected +0.4% rise
• Chicago PMI (Jul) came in at 52.6 versus an expected 61.8
The first four reports were release an hour or more before the open. The final report was released fifteen minutes into the session.
The big concern before the market opened was what will be the fall-out of a default on its bonds by Argentina. Argentina has done this repeatedly in the past, then taken on more debt and defaulted yet again. What will happen to Argentina and what about other countries getting sucked into the void?
Apple (AAPL 95.60 -2.55) fell most of three percent. AAPL constitutes about 20 percent of the NASDAQ-100 and nearly five percent of the S&P-500.
Seadrill Limited (SDRL 36.26 -0.19) was in positive territory most of the session but ended with a fractional loss. It is in a downtrend state. We sold March 2014 $35.00 put contracts for $150 at the open on Feb 18th, 2014 and bought shares at $35.43. The stock is now trading ex-dividend for $0.98 and one dollar for total dividends issued of $1.98. The shares were put to us at $35.00 less the $1.50 per share we were paid for the puts, so we have an effective price of $33.50.
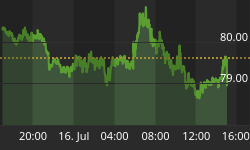
The U.S. dollar rose a tenth of one percent which appears to be a local top. The Euro closed essentially unchanged.
The yield for the 10-year treasuries rose a single basis point to close at 2.56. The price of a barrel of crude oil closed down -$2.10 to close at $98.17.
The implied volatility for the S&P-500 (VIX 16.95 +3.62) soared 27%! The implied volatility for the NASDAQ-100 (VXN 16.82 +2.89) soared 21%!.
Market internals were BEARISH. Decliners led advancers 10:1 on the NYSE and by 5:1 on the NASDAQ. The last time we had a 10:1 down ratio on the NYSE was March 6, 2012, which was followed by another week of moves higher. Down volume led up volume 8:1 on the NYSE and by 6:1 on the NASDAQ. The index put/call ratio fell -0.07 to close at 0.74. The equity put/call ratio rose +0.07 to close at 0.64. It is very strange that with such a significant sell-off, the index put/call ratio fell and the equity put/call ratio barely moved higher. This is a complacent market.
Conclusion/Commentary
Thursday clearly shook up some traders. With that said, put call ratios did not change much which means that complacency is way too high. The nervousness seemed to be focused on the prospect of fall-out from the Argentina bond default. With the Dow, S&P-500, and other equity indexes at oversold conditions, we would expect a bounce before a continuation of a move lower, or a reversal that ends the move lower soon. We will be looking to exit our long positions in DIA and SPY on a low volume bounce. Stay tuned for instructions.
We hope you have enjoyed this edition of the McMillan portfolio. You may send comments to mark@stockbarometer.com.


