


Precision timing for all time frames through a multi-dimensional approach to technical
analysis: Cycles - Breadth - P&F and Fibonacci price projections
and occasional Elliott Wave analysis
"By the Law of Periodical Repetition, everything which has happened once must happen again, and again, and again -- and not capriciously, but at regular periods, and each thing in its own period, not another's, and each obeying its own law... The same Nature which delights in periodical repetition in the sky is the Nature which orders the affairs of the earth. Let us not underrate the value of that hint." ~ Mark Twain
Current Position of the Market
SPX: Very Long-term trend - The very-long-term cycles are in their down phases, and if they make their lows when expected, there will be another steep decline into late 2014. However, the Fed policy of keeping interest rates low has severely curtailed the full downward pressure potential of the 40-yr and 120-yr cycles.
Intermediate trend - The correction is over and what is most likely the final phase of the uptrend (before a more serious correction) is underway.
Analysis of the short-term trend is done on a daily basis with the help of hourly charts. It is an important adjunct to the analysis of daily and weekly charts which discusses the course of longer market trends.
UNCERTAINTY RESOLVED WITH NEW HIGH
Market Overview
Last week the market closed with some uncertainty on the geopolitical front: "Would the situation in Ukraine worsen over the weekend, or not?" With the latter being the case, the market was given the all-clear to move higher and confirm its quest for a new high - which was reached by SPX at 1994.76 on Thursday. Friday started a minor correction which might have completed by the close in a very shallow wave 4 of 3 (from 1905). Ideally, the correction could extend a little deeper before the final phase of wave 3 gets under way, but it will be up to Monday's action to determine which course the index chooses over the near-term.
We are ready for some sort of correction. The daily indicators clearly show this with their overbought levels compounded by negative divergence. But this does not negate the possibility of moving a little higher first. If so, the challenge will be to decide if we are just now completing wave 3 of 3, or if we are ready to correct all of wave 3!
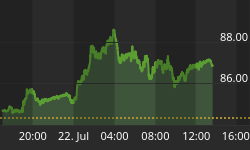
The QQQ is particularly challenging here since it could be the key to what comes next. Historically, QQQ and IWM have peaked before the rest of the market and started to correct ahead of it. On the P&F chart, QQQ appears to be at, or within a point of a projected high. Of course, P&F is not a perfect tool and can easily be misinterpreted. But in this case, the base pattern count taken at 86.50, is confirmed by a re-accumulation count taken at the 95 level. If correct, it should be reflected in the action of the index at any time.
IWM has been a laggard in this rally, trading still a good distance from its high, so it may be the first to signal a market top when it turns down decisively. DJIA corrected from a small wedge pattern and has still not made a new high, but it is still attainable with another rise of about 150 points. Incidentally, the DJ transportation has not made a new high either.
Chart Analysis
The Daily SPX (chart courtesy of QCharts.com) moved from support to resistance with very little hesitation. The smaller red channel turned out to be more accurate at determining the end of the correction once prices came out of it, but our focus should now be on where we are in the uptrend that started at 1905. The SPX was stopped by the top resistance line, but for how long? Ideally, we have started a correction of three or four days which will retrace to the level of the pink MA (at least) before extending its uptrend. But a slightly higher high cannot be discounted first! Ravenous bulls may be ready to send prices higher right away.

Looking at this from an EW perspective, the consensus is that wave 3 of 3 may have completed on Thursday, but there is an outside chance that wave 4 of 3 may have completed as well, on Friday - although that would leave us with a very shallow wave 4! So we need to wait until Monday to find out exactly where we are in this uptrend.
The indicators tend to favor some additional correction since the A/D oscillator (bottom) has already given a minor sell signal, the SRSI (middle) is on the verge of doing so, and the MACD is showing deceleration in its histogram. However, that is not conclusive and the index is not obligated to continue its correction right away.
Perhaps the Hourly Chart (also courtesy of QChart.com) will shed some light on the market's exact position. But before we leave the daily chart, note that negative divergence is beginning to form in the MACD. If it persists by the time that the index has completed its structure, we can almost be sure that whatever price has been reached will be the high of the year or, at a minimum, lead to a much more severe correction. A longer view of the chart shows that the MACD made its high last October and has been in a downtrend since while the price is in an uptrend. That spells trouble for the market!
Trend lines drawn on the hourly chart vary slightly from those of the daily chart, and on this chart, we can see that the top resistance line across the two tops was not quite reached by the SPX on Friday. A secondary resistance line stopped the advance temporarily. Will the index challenge the last line of defense before resting, or is it ready to do so now? It is clear that those parallel lines to the top have had some effect along the way, not the least of which is the one which created the low of the correction. But on the way up, they also served to restrain prices at various levels, so it is not surprising that another pull-back occurred after the next to the last one was reached.
This has been a strong advance. A top channel line has been drawn across the tops and every time prices were pushed back by it, they surged right back up. In the last phase of the advance, they even crawled just below it for four consecutive days. This tells me something: there has been no significant deceleration in the advance, and the high of the uptrend (wave 3) will not come until some is evident. It should take the form of a correction followed by a final push which will not reach the top channel line before it rolls over. Such a pattern should mark the end of wave 3 followed by a correction which will most likely come out of the bullish channel completely before starting wave 5.
Where we are exactly in the micro structure is somewhat murky. Will we expand into a slightly larger correction (wave 4 of 3), or is it already over? The only answer to that will be provided by the market itself. In its pull-back, the SPX has found support twice on the blue 21-hr EMA. This has created a very shallow retracement and, if the bulls are aggressive enough on Monday, they will cause another buying spree which will send the index to a new high. If so, there is a good chance that the index would next push to the top red resistance line which currently lies at about the 2000 level. After a pull-back from there, the structure should become clearer. On the other hand, if the price falls below the blue MA, we can expect the price to drop a few points lower. That, too, would clarify the structure.

The oscillators are oversold enough that we could see a rally develop from the get-go on Monday morning. However, since they have not yet given a buy signal, there could be more correction before they do. On Friday, there was a little rally in the futures after the close. Was that the normal Friday short-covering rally which came late, or does it signal the start of another uptrend on Monday? We'll see if there is some follow-through in Globex on Sunday
Cycles
The 21-day cycle high may have come the previous Friday as a one day affair!
A 9-day cycle was due last Friday and may have caused the 10-point correction in the SPX. Will it exercise more pressure on Monday?
The 10-wk Kress cycle peak is now one week past and is obviously experiencing right translation which is probably not over.
Breadth
The McClellan Oscillator and the Summation Index appear below (courtesy of StockCharts.com).
The McClellan Oscillator swept from oversold to overbought, with only a couple of wiggles. The action is similar to what happened in October and February. The former move started an SPX rally of about four months and the latter, three months. I doubt that this move will extend that length of time, but another couple of weeks would seem reasonable.
The action of the NYMO has caused a reversal to take place in the NYSI and its RSI. The latter moved to neutral by the end of the week. We'll keep an eye on the market when it gets overbought again.


Sentiment Indicators
The SentimenTrader (courtesy of same) long term indicator moved up to 60 this past Friday. It may have to reach 70 once again before we get to the top of the move.

VIX (CBOE volatility Index)
A close-up of VIX shows that it closed on the low of the week -- although it did not make a new low. Here also, the last downtick came after hours, following the action of the futures. It also spent most of Friday declining while the market was essentially trending down into the close. It seems to be saying that the up-move is not quite finished and that the market will have to go a little higher instead of adding to its correction. Only Monday's opening will give us a definite answer!

IWM (iShares Russell 2000)
As a leading index, IWM is beginning to tell us that a market high is near. It looks as if it has already created a double top and would have to display some unusual strength over the next couple of weeks to nullify the negative picture it is currently presenting.

TLT (20+yr Treasury Bond Fund)
TLT is in a classic uptrend channel and shows no sign of weakness. Odds are that its rise will continue until deceleration of the trend visibly sets in and it draws nearer to the lower channel line.

GLD (ETF for gold)
GLD is being hampered by the strength of the dollar. Breaking below the support line which it has now reached is now almost a sure bet, especially if the dollar continues to rise with the market (read UUP, next).

UUP (dollar ETF)
In the last letter, I had suggested that UUP was consolidating just below the mid-channel line in a pattern which showed no weakness. It has now clearly broken above, continuing its strong uptrend with no sign (yet) of turning back. This move appears to be targeting the top of the channel and, after a rest period, it could even push to about 24. It has the base for it!

USO (US Oil Fund)
As I suspected, USO is aiming to challenge its "bullish" long-term trend line which originated at 22.74 in February 2009 after a pecipitous decline from 109 in 2008. Does that tell us something about the current (and future) supply/demand ratio for oil?

Summary
If, a week ago, there was some uncertainty about SPX's ability to make a new high, it has been totally dispelled by last week's action. Furthermore, the uptrend looks as if it could continue for a while longer with the index reaching higher levels. We should know better a week from now if we are approaching a top and what the final high should be.
FREE TRIAL SUBSCRIPTON
Market Turning Points is an uncommonly dependable, reasonably priced service providing intra-day market updates, explanations, and commentary, plus detailed weekend reports. It is ideally suited to traders, but it can also be valuable to longer-term holders since price projections are provided using Point & Figure analysis along with best-time estimates obtained from cycle analysis.
For a FREE 4-week trial, Send an email to: ajg@cybertrails.com
For further subscription options, payment plans, weekly newsletters, and for general information, I encourage you to visit my NEW website at www.marketurningpoints.com. By clicking on "Free Newsletter" you can bring up the latest newsletter which is normally posted on Sunday afternoons (unless it happens to be a 3-day weekend; in which case it could be posted on Monday).


