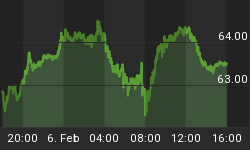
Gold has broken below $1200 this morning in what should begin the final breakdown. In weekly and monthly terms $1200 was the remaining support. Sure Gold could bounce from $1180 but todays breakdown is more significant. Both metals are now in breakdown mode while the mining stocks continue to slide. There is more downside ahead and bulls should continue to stand aside before a favorable buying opportunity emerges.
The monthly chart of Gold and Silver is below. We know that Silver has already broken down. It peaked before Gold and could bottom first. Silver is trading at $16.88 as I pen this. The next major monthly support is $15. With Gold trading at $1192, its next monthly support is below $1100. The 50% retracement is at $1080 and more support lies at $1040.
Those downside targets fit well with the bear analog charts. In this Gold specific chart we removed the two extreme bears. We can see how the current bear compares to three other bears.
The bear analog chart for Silver suggests its current bear market will end first and is very close to ending. In price terms this is now the second worst bear market ever for Silver. In terms of time it is close to being the third worst bear ever.
Turning to the miners, the HUI Gold Bugs Index is trading at 190 as we pen this. The weekly line chart shows 168 as very strong multi-year support. That is about 12% downside from current prices.
GDXJ (not shown) has been the strongest of the mining indices. It was the last to break its May low. It has 9% downside to its December low. GDXJ was down 82% at that low. Any breakdown to a new low is very likely to be a false breakdown given the current age and severity of the bear market.
We were bullish most of 2014 but quickly changed our tune as the evidence shifted. In our most recent editorial we noted the downside risk but the eventual shift from risk to an amazing opportunity. These charts are a few of the tools we can use to potentially identify the start of that amazing opportunity. For now, Gold and Silver continue to have more downside until very strong support targets. The same goes for the mining stocks. I see a potential lifetime buying opportunity in the weeks and months ahead.
Good Luck!
We invite you to learn more about our premium service including a report on our top 5 buys at the coming bottom.


