


How much higher can the dollar go? Betting on the Fed's paper has been one helluva speculation. No doubt the Fed's credit quality has been falling, but powerful forces are driving it up, such as desperate debtors clutching for cash to calm their creditors (sorry, couldn't resist).
The dollar was up this week, from 25.5 to 26.1mg gold, or alternatively from 1.76 to 1.86g of silver. Since this move began, the dollar has risen from around 16mg gold, or about 63%.
If one prefers to measure value in terms of other currencies, the dollar was up from €0.788 to €0.80. It went up from £0.615 to £0.626. It went up from CAD$1.115 to CAD$1.124, or AUD$1.14 to AUD$1.15. It went up from ![]() 39.14 (Russian rubles) to
39.14 (Russian rubles) to ![]() 39.98. It went up in Japanese yen, Brazilian reals, Indian rupees, Indonesian rupiahs. You get the picture. In the past year and three quarters, the dollar has gone up about 33% in rubles. Exciting times for Russian speculators, many of whom probably feel they're getting rich. Are they really? Not in our opinion.
39.98. It went up in Japanese yen, Brazilian reals, Indian rupees, Indonesian rupiahs. You get the picture. In the past year and three quarters, the dollar has gone up about 33% in rubles. Exciting times for Russian speculators, many of whom probably feel they're getting rich. Are they really? Not in our opinion.
Looked at the other way -- in terms of most readers' favorite paper currency -- the prices of the metals fell this week. As usual, this means the price of silver fell in terms of gold as well. The gold to silver ratio made a new high on Thursday of 71.1. Last week, we said the following:
"We have long predicted the ratio will hit 70 and maybe 80. So we will call our target 'hit'. Is this it? Will the ratio reverse direction, and will silver begin to rise in gold terms (and dollar terms) again?"
This wasn't quite a premature calling of the top (particularly in light of our silver analysis). But it was not necessary to reach for 70 last week, when this week the market has solidly hit it.
What about 80? Read on...
First, here is the graph of the metals' prices.
The Prices of Gold and Silver
We are interested in the changing equilibrium created when some market participants are accumulating hoards and others are dishoarding. Of course, what makes it exciting is that speculators can (temporarily) exaggerate or fight against the trend. The speculators are often acting on rumors, technical analysis, or partial data about flows into or out of one corner of the market. That kind of information can't tell them whether the globe, on net, hoarding or dishoarding.
One could point out that gold does not, on net, go into or out of anything. Yes, that is true. But it can come out of hoards and into carry trades. That is what we study. The gold basis tells us about this dynamic.
Conventional techniques for analyzing supply and demand are inapplicable to gold and silver, because the monetary metals have such high inventories. In normal commodities, inventories divided by annual production can be measured in months. The world just does not keep much inventory in wheat or oil.
With gold and silver, stocks to flows is measured in decades. Every ounce of those massive stockpiles is potential supply. Everyone on the planet is potential demand. At the right price. Looking at incremental changes in mine output or electronic manufacturing is not helpful to predict the future prices of the metals. For an introduction and guide to our concepts and theory, click here.
Next, this is a graph of the gold price measured in silver, otherwise known as the gold to silver ratio. It rose 2.4% this week.
The most likely course is on towards 75.
The Ratio of the Gold Price to the Silver Price
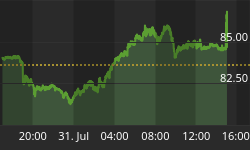
For each metal, we will look at a graph of the basis and cobasis overlaid with the price of the dollar in terms of the respective metal. It will make it easier to provide terse commentary. The dollar will be represented in green, the basis in blue and cobasis in red.
Here is the gold graph.
The Gold Basis and Cobasis and the Dollar Price
The cobasis may have finally broken out of its range since August, though it took a price below $1200 to make this happen. The cobasis is up noticeably on the week, from -0.21% to -0.15%.
There is no doubt that lots of physical metal has come to market in this period of falling prices since August. Maybe metal supplied to the market will dry up, and metal demanded will rise at the new, lower price? We prefer to call it as we see it, rather than predict such changes in behavior.
Now let's look at silver.
The Silver Basis and Cobasis and the Dollar Price
The silver price had another breakdown this week, losing 0.81 Federal Reserve Notes. But the cobasis fell. Silver had been in (a small) backwardation at the close of last week. Now the cobasis is 0.0000.
Last week, we wrote:
"We are 18 cents closer to a bottom, which is to say .01 gram closer to a high in the dollar as measured in silver. This could be 'it', but if so the drop in the silver cobasis on Friday isn't bolstering this view. Especially not a sharp '^' shaped turnaround in the dollar price (i.e. "v" shaped turnaround in the silver price)."
Now we are 81 more cents closer. And the cobasis fell despite this, or because of it. Definitely not an encouraging sign for those looking for an abrupt end to the dollar's relentless rally.
The Gold Standard Institute Presents The Gold Standard: Both Good and Necessary, in Manhattan on Nov 1. There hasn't been a real recovery from the crisis of 2008. The reason is not simply that the Fed has made a particular mistake. The cause of the crisis is the dollar itself. There will not be a recovery until we return to the use of gold as money. Please come to this talk to hear Keith Weiner's diagnosis of the dollar and urgent prescription for gold.


