


10/10/2014 8:10:37 AM
Good morning Traders,
Ok - I've totally over used that title lately, but the plain fact is we're seeing the culmination of our research playing out in our oil trade, which is up 488%!
Let's walk through it real quick:
Back on July 25, we recommended the following oil options.

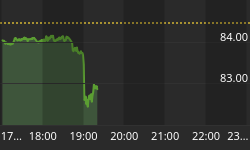
The October PUTS are now trading as follows:

And they may not be done!
On to the market, when I lecture on markets (as I will this weekend), I often hold up a rubber band and explain the market mechanics are very similar. As markets go down, like the rubber band, there's a natural tendency for forces to build that oppose that movement. But as with any system, it has a breaking point. There's a point when the market, or the rubber band, will break.
This moves us into a discussion on randomness and the potential for an event to initiate that none of us are aware of. Be it the collapse of a financial firm that will start playing out in the market. Or to steal from Naseem Taleb, a black swan, as this event becomes known, it will be played out in the market. We're approaching that point now with a little more room to explore some downside and still remain in the normal range. The rubber band could break and the system could face more challenges. Absent that, this is a normal pull back in a long term uptrend.

On the bullish side, money is pouring into Bonds. Money flow is merely a sentiment indicator as it correlates pretty closely to tops when money flow reaches an extreme. A bond top and reversal would be bullish for stocks.

Stepping back and looking at something we identified as this market continued higher - participation was decreasing. Now each indicator is different in how it contributes to understanding market movements. The New Highs is in the buy zone. But it can remain at this level for some time. It's influence is minimized at this point.
There are 12 indicators that make up the barometer algorithm.

And from our analysis of market bottoms is that they're never the same in how they develop, but they are the same in the overall levels that the indicators (or components) can reach. So as we go through the indicators, we look to relative levels (which we're at now) and historic levels - which could take us to the 1.2 level if the market breaks lower.
At that point, we'd do a deeper study of the individual components for more precise timing. Bottoms are easier to time that tops because fear is a much stronger emotion than hope, and accordingly, easier to read in the data.
Absent in all my writings is the news. It's easy to get caught up in subjective analysis of news events and forget the market is much more than one news event. To attribute it's movement to one such news event is what the media does. As humans, we like to think we know why something is happening. But do we really? I don't think so. That's why we rely solely on the data...
As we head into the weekend, and next week being options expiration, I believe how the markets set up over the next week can have significant implications on the next month or longer. So stay tuned - this is about to get interesting...
Regards,


