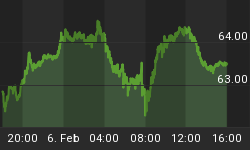
The price of oil has once again captured the headlines, making a new high this week at $62.50/barrel as the latest wave of reflation hits the financial markets.
In last month's commentary entitled "Crude oil and the dollar test the curves," we examined the parabolic structures in the daily charts of crude oil and the U.S. dollar index, noting in particular that oil would likely test the $62-$64 area before encountering its next significant resistance. While that test has been a while in coming, we're now seeing it and as this article's headline suggests, the price of crude is about to test the upper boundary of its dominant interim uptrend channel.

What gives oil's latest run some upside impetus is the fact that the price of oil had to break out from a parabolic dome, shown in the daily chart above. Notice that the most recent peak from last month at $62.35 (intraday) was to the right-of-center of the dome pattern (see circled area). From the standpoint of parabolic analysis this meant that the dome was destined to be broken to the upside since the peak was beyond the "vertex" of the dome. Breakouts from parabolic domes typically carry price above the previous high, as we've already seen this week in the crude oil market.
The red channel lines shown in the daily chart mark the boundaries of the dominant interim uptrend channel and the upper channel line intersects at approximately the $64 area. As previously stated we'll likely witness an attempt at hitting $64 or slightly higher this month before the next oil price correction, based on momentum considerations.

Concerning the dollar, I mentioned last month that "the important thing to consider is that the upward momentum for the dollar is still there and hasn't dissipated yet." Well obviously some of that near-term momentum has since dissipated as the dollar shows weakness and looks like it may test the lower boundary of its uptrend channel at the 86.50-87.00 area. This is where the important 90-day moving average also intersects, coinciding with the lower channel boundary. Once this area is tested, it will tell us whether the dollar has seen its top for the year.


