


11/18/2014 6:32:30 AM
Good morning Traders,
We've been here before. Prices hanging up near highs, approaching a key reversal date and expiration week is upon us. The barometer is reflecting the markets action:

As I like to say, the market makes about 7 mid term moves a year. So the barometer is simply a guide to what's going on in the markets, regardless of the news (which creates a bias). So when the barometer turns lower, but prices remain high, that creates buy trend mode. The potential for the markets to trend is significant. That's when stock trading becomes key, as index trading should produce minimal gains in this mode, stocks become the focus of traders and move more significantly.
That being said, one of our new traders has put together an educational email series on trading price gaps. You can click the following link to check it out. Note the emails are handled by Aweber, so you'll have to find the confirmation email after you sign up to actually start getting the emails: http://forms.aweber.com/form/33/1216030333.htm
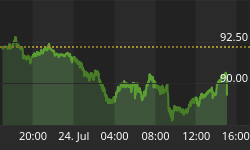
On the markets, one key indicator we've been watching:

The trending lower is bearish and note that the next bearish thing that we'll watch for is a cross below the 34 day moving average. Sorry, I'm a Fibonacci guy...
Another basic indicator:

This is just a gage on the overall positioning of the market. It doesn't mean the market will top, it just means that the potential exists.
Another basic indicator that gives a key measure on the market's sell pressure:

If you remember that the market is traded mostly by computers and buying and selling is hard to hide, this indicator is key.

Trin is less significant as an indicator, because it's based on 4 measures and their interpretation can be skewed by light volume. That being said, it's important to know where this indicator sits as it's the original Trading Index...
And finally, the VIX Put Call Ratio. I remember when this first came out. The volume was so light. In it's first month, there was a day when there were only 3 vix put contracts traded! Now, when the market is getting real scary, you'll see 1.3M CALL contracts traded (bets or hedges that the volatility will go up!)

My theory on the market is that what moves it is the underlying pressures created by the vehicles that are traded - not the news, though the news can be a catalyst for the timing of a position, it's the sum total aggregated or cumulative measure of actions taken that really drive the markets. The accumulation of all buying and selling of stocks, options, futures, on everything. So for example, if you look at the above and the amount that trading has grown on it since the 2/24/06 it started trading in the markets to where it is now - instant portfolio hedging protection.
So as I always say, when the crowd leans to the left, we need to lean to the right and that's where profitability exists... I feel like we're getting close to a catalyst that will move the markets. And also note the Wednesday before expiration can be a little crazy as that's when larger institutions will start rolling positions - so stay tuned...
Regards,


