


Personal note: I have been invited to speak at the Mines and Money London Conference on December the 2nd 2014. My presentation is called "What is the influence of ETFs on gold and silver?" As well I am going to moderate the panel session stream A on Thursday 4h of December about "How are exchanges helping the mining industry in today's economic climate?". If you would like to join you can receive 25% off your delegate pass by using my discount code: ML875SPK.
Review:
- In my last analysis from 19th of October I expected Gold to break down below US$1,180.00 rather sooner than later. After a final push towards US$1,256.00 the bears took over again and Gold sold off all the way down to US$1,130.00.
- Unfortunately Gold never made it to my recommended entry level (US$1,275.00-US$1,285.00) for a short sell swing-trade.


Arguments for lower prices:
- 3.3-years downtrend: Overall Gold still is in a downtrend. US$1,525.00 remains the line in the sand. Gold will need much more time to break through this heavy resistance. Only a move above US$1,350.00, US$1,390.00 and especially US$1,430.00 will indicate that the mid- and longer-term trend indeed has changed. A sustainable move above US$1,275.00 would already brighten up the technical picture. The 8-year cycle for Gold should bring a significant low around 2015/2016. It could mean that this bear market has to continue for one or two more years. But we are very likely in the last quarter.
- Gold Monthly Chart: The long term up-trendline has been clearly broken. The chart remains in bear market mode. The MACD indicator has been moving away from a buy signal. The charts looks like gold will need to test the strong support zone between US$1,050.00 and US$980.00 before a new up trend can begin.
- Gold Weekly Chart: The bearish descending triangle continues to be the important formation here. As well the MACD sell signal remains in place. Gold is respecting the downtrend channel which creates heavy resistance around US$1,230.00 and US$1,270.00.
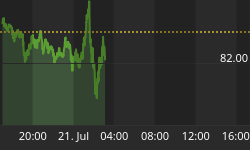
- Gold Daily Chart: Short-term Gold is in an up trend but is struggling to push sustainably through the US$1,200.00 level. The 50-MA (US$1,206.04) and the upper Bollinger Band (US$1,219.06) are resistance. The chart is not oversold anymore and the overall downtrend could resume anytime.
- Gold Stocks: HUI index crashed through important support around 183 points. The recent recovery has brought the index back to this zone which now acts as resistance. Tax loss selling might affect the mining shares in the coming weeks.
- US-Dollar: One of the main catalysts behind the falling gold price has been the strong US-Dollar. Besides some negative divergences there are no technical signals yet that the dollar is topping out indeed.
Arguments for higher prices:
- Gold Monthly Chart: No bullish indication but prices have recently spiked below the lower Bollinger Band which was unsustainable. Also note that the rising lower Bollinger Band is supporting Gold at US$1,144.08.
- Gold Weekly Chart: Although Gold broke through the descending triangle it did not happen in a very decisive manner. Instead Gold has already regained the US$1,180.00 resistance and is close to the US$1,200.00 level as well. The "ParabolicSar-Indicator" is about to switch to a long signal if Gold pushes above US$1,207.60. RSI and stochastic seem to have turned around already.
- Gold Daily Chart: With two big up days driven by short covering gold is up nearly 6.8% in the last 13 trading days. On 7th of November a morning star candle appeared on the chart and clearly indicated a short-term reversal to the upside. The falling 50-MA (US1,206.04) is acting as a magnet and Gold is oscillating around this moving average since about one week already. The next target and at the same time next resistance is the upper Bollinger Band (US$1,219.06). The slow stochastic indicator is about to embed with both lines above 80 for three consecutive days. This is locking in the bullish trend.
- Euro-Gold: €-Gold briefly touched the june lows at 907.00€ only to turn higher again. The ascending triangle is still in play and it looks like €-Gold wants to test the psychological level around 1,000.00€ soon. A breakout would create an immediate upside potential to around 1,075.00€
- Sentiment: Besides the recent recovery sentiment remains at excessive pessimism levels. During the first week of November many extremely bearish forecasts appeared and some famous newsletter-writes even started to finally sell gold short. This type of sentiment continues to support higher prices as the majority is short gold hoping for lower prices.
- Seasonality: Generally seasonality now is very supportive for gold and silver until mid of february. November tends to be the second best month of the year while December statistically sums up with a minor loss. Short-term seasonality is supportive until mid of December.
- CoT-Data: According to the latest CoT-Data the commercials had a 70,997 net short position in COMEX Gold Futures last tuesday. The week before this number was at 50.024 which coincides with a 10-month low. Clearly the smart money is playing the gold-market well and now seems to be positioned for higher gold prices again. At the same time the managed money (hedge funds and commodity pool operators) ramped up their shorts to 19% open interest which statistically is not sustainable. The CoT-Data now supports at least a larger recovery for gold.
- Volatility: On November 7th the CBOE Gold Volatility Index reached a 16-month high at 23.36 indicating high levels of fear and panic in the gold market. Since then volatility has eased. Negative divergences pointing to lower levels of volatility which limits downside risk in gold price.
- Gold/Silver Ratio: The ratio reached my target of around 77 points and posted an island reversal candle outside the bollinger bands on the same trading day. I think we have seen the lows of this bear market in silver already. The zone around US$15.00 is massive support and silver has been stronger than gold in the last two weeks pushing the ratio down to currently 72.11 points. Even if gold will go down to US$1,050.00 I am making the bold call that silver will not make a lower low anymore! Instead it should have bottomed before Gold!
- Gold-Stocks: After being pushed down to an 8-year low at 146.01 points the HUI Gold Bugs Index managed to recover 24.2% within one week. The Gold stocks starting to outperform gold again which is a positive sign. The sector has been massively beaten down in the last 3.5 years and remains in liquidation.
- US-Dollar: After a massive 6-month rally the market's most crucial extreme is in the US-Dollar. The rally has pushed the currency to a 4.5 year high and sentiment (Optix) to extreme levels. The recent Commitment of Traders (CoT) report on the US-Dollar is coming off its most positive readings in history. When sentiment readings like the CoT and Optix signal extreme optimism, the opposite usually occurs... A falling US-Dollar is getting more and more likely here.
Conclusion:
- Although the bullish arguments are not overwhelming at this point I think this rally has more legs. Short-term Gold should climb until US$1,215.00-1,220.00. After a setback that should hold above the US$1,175.00 level the 200-MA (US$1,276.58) becomes the logical next target. As this moving average will start falling in the next couple of weeks Gold might able to push towards US$1,255.00 until january or february 2015. Overall I think this bear market is not over yet and Gold will need to make another lower low (maybe in may or june 2015?). But short-term the bulls have the advantage.
- Swing-traders could buy any setback towards US$1,175.00 with a hard stop at US$1,145.00 and a target of US$1,255.00 which gives a reasonable risk/reward-ratio of 1 to 2.66. Depending on future developments Gold around US$1,255.00 might offer a good shorting opportunity in the coming months.
- Investors with a long-term perspective should continue to accumulate physical Gold below US1,200.00. I recommend to put 10-20% of your net-worth into physical Gold and Silver as an insurance and hedge against the growing imbalances in our financial system.
Long term:
- Nothing has changed
- Precious Metals secular bull market continues and is moving step by step closer to the final parabolic phase (could start within 1-2 years and last for 2-5 years or even longer)
- Price target DowJones/Gold Ratio ca. 1:1
- Price target Gold/Silver Ratio ca. 10:1 (for every ounce of gold there are 9 ounces of silver mined, historically the ratio was at 15:1 during the roman empire)
- My personal price target remains at US$5,000.00 to US$8,900.00 for Gold within the next 5-8 years
- Fundamentally, when the current bear market is over Gold should start the final 3rd phase of this long term bull market. 1st stage saw the miners closing their hedge books, the 2nd stage continuously presented us news about institutions and central banks buying or repatriating gold. The coming 3rd and finally parabolic stage will end in the distribution to small inexperienced new investors who will be subject to blind greed and frenzied panic.


