


The good news is:
• There has not been a significant build up of new lows.
The new high indicator (NH) is a 10% trend (19 day EMA) of NASDAQ new highs.
The chart below shows the NASDAQ composite (OTC) in red and NH in green.
The chart covers this calendar year, there are dashed vertical lines drawn on the 1st trading day of each month.
NH is a good short term indicator and it is falling. The current value of the indicator is 114 so it would require more than 114 NASDAQ new highs to turn the indicator upward.

Summation indices (SI) are running totals of oscillator values. The chart below shows the OTC in red along with SI's calculated from oscillators generated from NASDAQ advances - declines, new highs - new lows and upside - downside volume. SI's are good intermediate term indicators and they are all heading downward.

The secondaries lead both up and down.
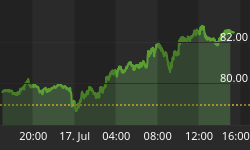
The next chart shows the Russell 2000 (R2K) in red and the S&P 500 (SPX) in green along with a FastTrack relative strength indicator called Accutrack as a histogram in yellow.
Accutrack peaked in early mid-July and is about to go negative indicating the secondaries are no longer outperforming the blue chips.

Seasonally the week prior to the 3rd Friday in August during the 1st year of the presidential cycle has not been kind to the market. Option expiration has been thought to be a factor, but in the tables below you can see the indices were performing badly for 20 years before options became an issue in the mid 1980's.
Report for the week prior to options expiration in August.
| OTC Presidential Year 1 | ||||||
| Year | Mon | Tue | Wed | Thur | Fri | Totals |
| 1965-1 | 0.70% | -0.22% | 0.26% | 0.24% | -0.26% | 0.72% |
| 1969-1 | -0.29% | -0.79% | -0.94% | -0.10% | 0.42% | -1.71% |
| 1973-1 | -0.92% | -0.73% | -0.23% | -0.04% | 0.39% | -1.53% |
| 1977-1 | 0.13% | -0.24% | 0.07% | 0.14% | -0.01% | 0.09% |
| 1981-1 | -1.16% | -1.26% | 0.10% | 0.36% | -0.58% | -2.54% |
| Avg | -0.31% | -0.65% | -0.15% | 0.12% | -0.01% | -1.00% |
| 1985-1 | -0.28% | -0.43% | 0.21% | -0.01% | -0.39% | -0.90% |
| 1989-1 | -1.40% | 1.08% | -0.03% | 0.01% | 0.25% | -0.09% |
| 1993-1 | 1.20% | 0.57% | 0.52% | -0.59% | 0.07% | 1.76% |
| 1997-1 | -0.73% | -0.67% | 0.46% | 0.21% | -1.56% | -2.29% |
| 2001-1 | 1.32% | -0.89% | -2.32% | 0.60% | -3.28% | -4.58% |
| Avg | 0.02% | -0.07% | -0.23% | 0.04% | -0.98% | -1.22% |
| OTC summary for 1st presidential year 1965 - 2001 | ||||||
| Avg | -0.14% | -0.36% | -0.19% | 0.08% | -0.50% | -1.11% |
| Win% | 40% | 20% | 60% | 60% | 40% | 30% |
| OTC summary for all years 1963 - 2004 | ||||||
| Avg | 0.22% | -0.02% | 0.18% | 0.00% | -0.15% | 0.23% |
| Win% | 64% | 51% | 63% | 54% | 55% | 55% |
| SPX Presidential Year 1 | ||||||
| Year | Mon | Tue | Wed | Thur | Fri | Totals |
| 1929-1 | 1.53% | 0.89% | 0.30% | 0.17% | 1.85% | 4.74% |
| 1933-1 | -1.23% | 0.19% | -2.67% | 2.00% | -1.67% | -3.38% |
| 1937-1 | -0.87% | -0.58% | -0.94% | -1.48% | -1.02% | -4.88% |
| 1941-1 | -0.10% | 0.00% | -0.49% | 0.40% | -0.99% | -1.18% |
| 1945-1 | -1.15% | 0.62% | 0.00% | 1.65% | -0.54% | 0.57% |
| 1949-1 | -0.46% | 0.26% | 1.11% | 0.26% | -0.58% | 0.60% |
| 1953-1 | -0.24% | -0.41% | -0.61% | -0.08% | 0.25% | -1.10% |
| 1957-1 | -1.26% | -0.06% | -1.23% | 0.04% | 0.17% | -2.33% |
| 1961-1 | -0.50% | -0.25% | 0.27% | 0.56% | 0.26% | 0.34% |
| Avg | -0.72% | 0.03% | -0.12% | 0.49% | -0.09% | -0.39% |
| 1965-1 | 0.12% | 0.20% | -0.06% | -0.23% | -0.12% | -0.09% |
| 1969-1 | -0.62% | -0.78% | 0.08% | 0.69% | 0.71% | 0.07% |
| 1973-1 | -1.01% | -0.96% | 0.29% | -0.70% | 0.02% | -2.36% |
| 1977-1 | 0.31% | -0.46% | 0.01% | -0.06% | -0.17% | -0.38% |
| 1981-1 | -0.96% | -0.85% | 0.29% | 0.15% | -1.12% | -2.48% |
| Avg | -0.43% | -0.57% | 0.12% | -0.03% | -0.14% | -1.05% |
| 1985-1 | -0.37% | -0.18% | 0.06% | -0.08% | -0.62% | -1.18% |
| 1989-1 | -0.49% | 0.48% | 0.28% | -0.35% | 0.46% | 0.38% |
| 1993-1 | 0.50% | 0.17% | 0.64% | 0.09% | -0.06% | 1.33% |
| 1997-1 | 0.37% | -1.12% | -0.49% | 0.30% | -2.59% | -3.53% |
| 2001-1 | 0.09% | -0.38% | -0.73% | 0.31% | -1.67% | -2.38% |
| Avg | 0.02% | -0.21% | -0.05% | 0.05% | -0.90% | -1.08% |
| SPX summary for 1st presidential year 1929 - 2001 | ||||||
| Avg | -0.33% | -0.18% | -0.22% | 0.19% | -0.39% | -0.91% |
| Win% | 32% | 39% | 56% | 63% | 37% | 37% |
| SPX summary for all years 1928 - 2004 | ||||||
| Avg | 0.14% | 0.06% | -0.05% | 0.08% | -0.08% | 0.15% |
| Win% | 61% | 57% | 55% | 53% | 55% | 56% |
There is little to recommend the market right now. Most short and intermediate term indicators are moving downward and seasonally next week has been weak.
I expect the major indices to be lower on Friday August 19 than they were on Friday August 12.
Last week the large cap indices rose slightly while the small cap indices fell slightly so I am calling last weeks negative forecast a tie.
This report is free to anyone who wants it, so please tell your friends. If it is not for you, reply with REMOVE in the subject line.


