• 948 days Will The ECB Continue To Hike Rates?
  • 948 days Forbes: Aramco Remains Largest Company In The Middle East
  • 950 days Caltech Scientists Succesfully Beam Back Solar Power From Space
  • 1,350 days Could Crypto Overtake Traditional Investment?
  • 1,355 days Americans Still Quitting Jobs At Record Pace
  • 1,356 days FinTech Startups Tapping VC Money for ‘Immigrant Banking’
  • 1,360 days Is The Dollar Too Strong?
  • 1,360 days Big Tech Disappoints Investors on Earnings Calls
  • 1,361 days Fear And Celebration On Twitter as Musk Takes The Reins
  • 1,362 days China Is Quietly Trying To Distance Itself From Russia
  • 1,363 days Tech and Internet Giants’ Earnings In Focus After Netflix’s Stinker
  • 1,367 days Crypto Investors Won Big In 2021
  • 1,367 days The ‘Metaverse’ Economy Could be Worth $13 Trillion By 2030
  • 1,368 days Food Prices Are Skyrocketing As Putin’s War Persists
  • 1,370 days Pentagon Resignations Illustrate Our ‘Commercial’ Defense Dilemma
  • 1,370 days US Banks Shrug off Nearly $15 Billion In Russian Write-Offs
  • 1,374 days Cannabis Stocks in Holding Pattern Despite Positive Momentum
  • 1,375 days Is Musk A Bastion Of Free Speech Or Will His Absolutist Stance Backfire?
  • 1,375 days Two ETFs That Could Hedge Against Extreme Market Volatility
  • 1,377 days Are NFTs About To Take Over Gaming?
readtheticker

readtheticker

readtheticker

We are financial market enthusiasts using methods expressed by the Gann, Hurst and Wyckoff with a few of our own proprietary tools. Readtheticker.com provides online…

Contact Author

  1. Home
  2. Markets
  3. Other

Gann Angles on The Dow Jones Industrials

Gann Angles on The Dow Jones Industrials

A trend lines requires 2 points to draw, and Gann Angle only requires 1 point, a huge difference.

Why?

Simply that Gann Angle is not determined by price pivot points at the last price end, where as a trend line is. That is the beauty!

A Gann angle is a measure of the speed of the advance or decline, a measure of time by price of the price action.

The blue arrows show points of support along the blue dotted 2x1 Gann Angle, as stated above drawn off 1 pivot point. A trend line can not do that!

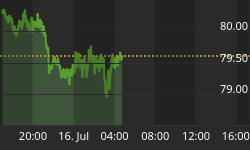
As you can see price is now entering a pinch zone, it will bust out either way.

Example of the INDU

Dow Industrials Gann Charts
Larger Image

NOTE: readtheticker.com does allow users to load objects and text on charts, however some annotations are by a free third party image tool named Paint.net

Investing Quote...

"Anyone who buys or sells a stock, a bond or a commodity for profit is speculating if he employs intelligent foresight. If he does not, he is gambling." ~ Richard D Wyckoff

"Look at market fluctuations as your friend rather than your enemy; profit from folly rather than participate in it." ~ Warren Buffett


Back to homepage

Leave a comment

Leave a comment