• 756 days Will The ECB Continue To Hike Rates?
  • 757 days Forbes: Aramco Remains Largest Company In The Middle East
  • 758 days Caltech Scientists Succesfully Beam Back Solar Power From Space
  • 1,158 days Could Crypto Overtake Traditional Investment?
  • 1,163 days Americans Still Quitting Jobs At Record Pace
  • 1,165 days FinTech Startups Tapping VC Money for ‘Immigrant Banking’
  • 1,168 days Is The Dollar Too Strong?
  • 1,168 days Big Tech Disappoints Investors on Earnings Calls
  • 1,169 days Fear And Celebration On Twitter as Musk Takes The Reins
  • 1,171 days China Is Quietly Trying To Distance Itself From Russia
  • 1,171 days Tech and Internet Giants’ Earnings In Focus After Netflix’s Stinker
  • 1,175 days Crypto Investors Won Big In 2021
  • 1,175 days The ‘Metaverse’ Economy Could be Worth $13 Trillion By 2030
  • 1,176 days Food Prices Are Skyrocketing As Putin’s War Persists
  • 1,178 days Pentagon Resignations Illustrate Our ‘Commercial’ Defense Dilemma
  • 1,179 days US Banks Shrug off Nearly $15 Billion In Russian Write-Offs
  • 1,182 days Cannabis Stocks in Holding Pattern Despite Positive Momentum
  • 1,183 days Is Musk A Bastion Of Free Speech Or Will His Absolutist Stance Backfire?
  • 1,183 days Two ETFs That Could Hedge Against Extreme Market Volatility
  • 1,185 days Are NFTs About To Take Over Gaming?
Zombie Foreclosures On The Rise In The U.S.

Zombie Foreclosures On The Rise In The U.S.

During the quarter there were…

Is The Bull Market On Its Last Legs?

Is The Bull Market On Its Last Legs?

This aging bull market may…

How The Ultra-Wealthy Are Using Art To Dodge Taxes

How The Ultra-Wealthy Are Using Art To Dodge Taxes

More freeports open around the…

  1. Home
  2. Markets
  3. Other

This Past Week in Gold

SPDR Gold Trust Shares Daily Chart
GLD - on sell signal.


iShares Silver Trust Daily Chart
SLV - on sell signal.


Market Vectors Gold Miners Daily Chart
GDX - on sell signal.


XGD.TO Daily Chart
XGD.TO - on sell signal.


Central Fund of Canada Daily Chart
CEF - on sell signal.


Daily Gold Chart

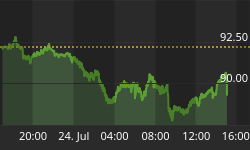
As noted in previous analysis, gold continues to make lower highs and this time is no different. Until this trend is reversed, gold is in a bear market and rallies to the 200ema should be sold.

Summary
Long term - on major sell signal since Mar 2012 when $HUI was at 550.
Short term - on new sell signals.
Gold sector cycle - down as of 2/07, ending the up cycle since November.
A bear market rally has completed, short sellers should sell into any bounces.


Back to homepage

Leave a comment

Leave a comment