


The Dow and S&P 500 closed the week at record highs on Friday while the Nasdaq notched an eighth straight day of gains after Greek and euro zone finance ministers reached a deal to extend heavily indebted Greece's financial rescue by four months. With better macro news coming from Europe relating to both Greece and Ukraine the equity market pushed higher perhaps on some short covering before the long weekend. About 6.3 billion shares changed hands on U.S. exchanges, below the 7 billion average for the month to date, according to BATS Global Markets.
Nasdaq and MidCap indexes are leading stocks recent surge higher as all the major equity indexes moved into the black the past few weeks. Gold has provided the highest return for the year, but along with Treasury Bonds have been crashing hard the past few weeks. For the week, the Dow was up 0.7 percent, the S&P 500 was up 0.6 percent and the Nasdaq was up 1.3 percent.

A tool to help confirm the overall market trend is the Bullish Percent Index (BPI). The Bullish Index is a popular market "breadth" indicator used to gauge the internal strength/weakness of the market. It is the number of stocks in an index (or sector) that have point & figure buy signals relative to the total number of stocks that comprise the index (or sector). So essentially it is the percentage of stocks that have buy signals. Like many of the market internal indicators, it is used both to confirm a move in the market and as a non-confirmation and therefore divergence indication. If the market is strong and moving up, the BPI should also be moving higher as more and more stocks are purchased.
The current chart below indicates recent analysis is still in play"...the S&P 500 Bullish Percent Index is breaking out of a trading range to the upside. The index needs to continue moving higher next week to confirm the breakout...the uptrend continues but needs to go higher to reach breakout level..."

The Nasdaq matched an eight-session winning streak from a year ago and inched closer to its 5,132.52 all-time intraday high, reached in March 2000 just before the dot-com bubble burst. Last week we commented "...The Nasdaq Composite BPI had been stuck in a tight trading range the past three weeks...this index jumped out of its trading range into a new uptrend. The Nasdaq Composite BPI needs to move up a little higher to signal a bullish breakout..." The current chart below confirms the bullish breakout. Nasdaq and Mid-Cap stocks have been leading the market higher and are proving to be the bellwethers for which way stocks are headed. This week the Nasdaq Composite recorded 107 new highs and 23 new lows.

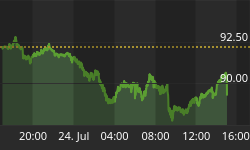
The updated chart below indicates our recent analysis is still valid "...gold and treasury bonds continue to drop off from high levels while the dollar remains elevated. The dollar is strong as the currency of last resort during global economic uncertainty. Confidence that the Federal Reserve will raise interest rates well ahead of Japan and the Eurozone...Gold seems to be under pressure from a stronger dollar but also because it is likely to have run out of buying pressure as the fund long position is already at near an extreme level, while the gross short position is relatively small so there was less buying pressure from short covering in recent weeks... If worldwide economic issues continue to wane this should put further downward pressure on commodities while the dollar remains firm..."

Market Outlook
In the first quarter of the year, the leading asset classes are Mid-Capitalization stocks and Real Estate. Both of these groups benefit from a strong domestic economy and their fortunes are more directly tied to what happens in the U.S. The companies that compose the Mid-Cap index have less exposure to overseas markets compared to the larger indexes, plus there are a limited number of energy suppliers in the group.

A standard chart that we use to help confirm the overall market trend is the Momentum Factor ETF (MTUM) chart. Momentum Factor ETF is an investment that seeks to track the investment results of an index composed of U.S. large- and mid-capitalization stocks exhibiting relatively higher price momentum. This type of momentum fund is considered a reliable proxy for the general stock market trend. We prefer to use the Heikin-Ashi format to display the Momentum Factor ETF. Heikin-Ashi candlestick charts are designed to filter out volatility in an effort to better capture the true trend.
Last week's Momentum Factor ETF (MTUM) chart analysis said "...Next week is critical for determining whether the major equity indexes will remain range-bound or break into a new uptrend...stock indexes are near the top of their trading ranges. We need to see a confirmed move higher before we can say the market is breaking out of the trading range..." The updated chart below highlights a confirmed breakout. Next we need to see if the uptrend continues or are we close to a near-term market top. The best bet is a market top to establish a new resistance level.

In the updated chart below you can see the S&P 500 Index reached another end-of-week record high as the Volatility index is contained near the bottom of its recent trading range. Investors are getting over recent concerns about the stock market being overdone. If this complacency continues the VIX is due to break through the bottom if it's trading range.

The current Put/Call ratio shows investors aggressively buying calls anticipating the stock market will continue higher. This ratio is exceptionally bullish and might be a sign the market's current uptrend is due for a pause.

The current American Association of Individual Investor (AAII) survey results have gotten excessively bullish, primarily at the expense of the bearish reading which is extraordinary low. Stocks have confirmed a breakout to new highs, but as a contrarian indicator the AAII survey signals the market is due for pullback from the current highs.


The National Association of Active Investment Managers (NAAIM) Exposure Index represents the average exposure to US Equity markets reported by association members. The green line shows the close of the S&P 500 Total Return Index on the survey date. The purple line depicts a two-week moving average of the NAAIM managers' responses. As the name indicates, the NAAIM Exposure Index provides insight into the actual adjustments active risk managers have made to client accounts over the past two weeks. Fourth-quarter NAAIM exposure index averaged 67.77%. Last week the NAAIM exposure index was 84.05%, and the current week's exposure is 87.91%. Expect Money Managers to retain a relatively high equity exposure as fourth-quarter earnings season winds down.


Trading Strategy
Investing in the leading companies in the sectors that stand to benefit most from the improving domestic economy is a good bet. As displayed below in the S&P sector graph, over the past month Cyclicals, Materials and Energy sectors are the leading performers. These are the primary sectors that should be expected to do well during the recovery phase of a cyclical economy. As the U.S. economic recovery continues, stocks of the top companies in these cyclical sectors can be expected to do well. Conversely, Utilities have converted from the top performing sector to the biggest loser. We recently mentioned how investors were buying utility stocks for their yield during global economic uncertainty. Now investors are abandoning safe-haven utilities stocks as they anticipate U.S. Federal Reserve interest rate increases later this year.

Feel free to contact me with questions,


