• 313 days Will The ECB Continue To Hike Rates?
  • 314 days Forbes: Aramco Remains Largest Company In The Middle East
  • 315 days Caltech Scientists Succesfully Beam Back Solar Power From Space
  • 715 days Could Crypto Overtake Traditional Investment?
  • 720 days Americans Still Quitting Jobs At Record Pace
  • 722 days FinTech Startups Tapping VC Money for ‘Immigrant Banking’
  • 725 days Is The Dollar Too Strong?
  • 725 days Big Tech Disappoints Investors on Earnings Calls
  • 726 days Fear And Celebration On Twitter as Musk Takes The Reins
  • 728 days China Is Quietly Trying To Distance Itself From Russia
  • 728 days Tech and Internet Giants’ Earnings In Focus After Netflix’s Stinker
  • 732 days Crypto Investors Won Big In 2021
  • 732 days The ‘Metaverse’ Economy Could be Worth $13 Trillion By 2030
  • 733 days Food Prices Are Skyrocketing As Putin’s War Persists
  • 735 days Pentagon Resignations Illustrate Our ‘Commercial’ Defense Dilemma
  • 736 days US Banks Shrug off Nearly $15 Billion In Russian Write-Offs
  • 739 days Cannabis Stocks in Holding Pattern Despite Positive Momentum
  • 740 days Is Musk A Bastion Of Free Speech Or Will His Absolutist Stance Backfire?
  • 740 days Two ETFs That Could Hedge Against Extreme Market Volatility
  • 742 days Are NFTs About To Take Over Gaming?
Another Retail Giant Bites The Dust

Another Retail Giant Bites The Dust

Forever 21 filed for Chapter…

How The Ultra-Wealthy Are Using Art To Dodge Taxes

How The Ultra-Wealthy Are Using Art To Dodge Taxes

More freeports open around the…

Zombie Foreclosures On The Rise In The U.S.

Zombie Foreclosures On The Rise In The U.S.

During the quarter there were…

  1. Home
  2. Markets
  3. Other

The State of The Trend

In our January 18th article we concluded that weak seasonality is behind us and the markets are approaching several consecutive weeks with strong bullish bias. The seasonally strong period started on Monday, Feb 2nd (green shaded area). During the last three weeks all three major averages (GJIA, SPX and NDX) made new highs, with the SPX gaining a little over 6.5%:

S&P500 Daily Chart

The fly in the ointment is that the DJ Transportation average has failed to make a new high yet, thus manifesting non-confirmation with the DJIA.

Looking forward, seasonality suggests that during the next few weeks the averages should enter a sideways/down phase.

One of the easiest ways to follow the ebb and flow of price movement, without the associated noise and random volatility is to use OT Trend Bars™. They offer several advantages over Renko, Kagi, and Trend break charts, and are suitable for long and short-term traders alike. They can also help shed any ambiguity associated with the use of other traditional TA tools. OT Trend Bars™ not only show the direction of the underlying true trend, but they are designed to get longer when the trend gets stronger, and to get shorter when the trend weakens or is about to end, thus giving advance warning when caution is needed:

S&P500 Chart
Chart courtesy of OT Seasonal

In summary, the trend for the major averages remains up and will continue to do so until the January lows are broken.

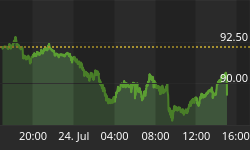
By contrast, the outlook for gold does not look very encouraging. GLD is currently testing key support. A break below the 50% retracement of the '08 - '10 upswing at 113.6 will signal that the lower cascading pattern will continue to unfold, pointing to a first downside target of 92.925:

SPDR Gold Trust Shares Monthly Chart
Larger Image

SPDR Gold Trust Shares Weekly Chart


Back to homepage

Leave a comment

Leave a comment