It does not matter what your specialty is for trading is we all have our own little trading secrets to help use better time our trades. While many day traders focus on individual stocks like aapl, goog, tsla etc... I like to focus on day trading gold.
Years ago I shared this little secret on how I get an edge day trading gold and it still amazes me how many of those people still use it today, including myself.
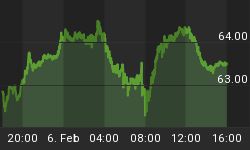
Time and time again gold traders are given great insight on how and when to day trade gold. I use the free 24hour Kitco gold chart which is shown below, and I watch it like a hawk.
It is easy to get a feel for how gold moves each day with this chart. Once you get a feel for it and see price patterns repeat themselves week after week, these opportunities quickly become an easy way to add a few trades to your day trading routine.
This Kitco day trading gold chart is an amazing tool for observing the price of gold over a 3 day time frame. What I'm going to show you is how it can provide opportunities for day trading gold.
While this chart may not look like a quality trading tool it does provides very detailed information for daytrading gold and for swing traders as they get ready to enter or exit positions. Looking at the chart below you will notice that price has similar price patterns and turning times throughout the day. Often enough the movements are very similar allowing us to take advantage of these price patterns to day trade precious metals, silver included.
Free Day Trading Gold Charts - By Kitco

Close Up of the Spot Day Trading Gold Chart
The chart below is regular trading hours only 9:30am - 4:00pm ET. You can see the price action following the previous day's movements. Blue is the previous trading day and Green is the Current day.
When there are large price movements in gold during these hours I like to take advantage of them using the previous days price action as my guide. If you didn't notice the Green line (Today) makes the move before the previous days move. Why? Looks to me like there are a lot of other traders out there like me getting ready for these opportunities and because its human nature to want to be first they cause the moves to happen slightly sooner than the previous day. You should factor this into your trading and be ready to take action when price looks to be starting a predicted move.

Intraday Trading Gold Chart via GLD
The chart below shows the last 4 intraday sessions for gold using the GLD ETF. As you can see these sessions had very similar price movement. This is a 5 minute chart of gold using GLD. I trade it using the 3 minute chart as it allows the best timing for entering and exiting positions and this 5 minute chart keeps my head clear for the key turning points because it is easy to get caught up in the one minute chart noise and miss the important patterns.
If you prefer trading spot golc via FOREX/CDF/Spread Betting and you are not a US resident you can use the firm which I have been using for nearly 8 years and the broker is AVAFX. The nice thing about trading this way is that you can trade 24/7, you get a lot of leverage, its commission free trading, and they have 100% signup bonuses to match the amount you deposit.

Example Day Trading Gold Chart

Above is the chart of GLD ETF and some actual trades. I am a very conservative trader and I like to lock in profits once I am satisfied with a move or if the chart shows any indication it may go against my position. I tend to exit trades a little too early but my focus is on catching the middle section of a trend because they are the safest areas to trade I think.
When there are no swing trading setups I focus on finding these intraday day trading gold patterns along with SP500 index and Nasdaq day trades to generate my weekly income.
My main focus for trading is swing trading ETFs and I have an automated trading system which i developed and it trades most of my capital on autopilot.
To sum things up I wait for a trend reversal or continuation pattern to form before I enter and exit positions. I am a firm believer of using breakeven stops, meaning once a position moves a certain amount in my favor I move my exit order to my entry price so that I have a risk free trade running. My swing trading goal for GLD ETF is 2-5% per trade which would last 2-10 days.
Get My Free Weekly Trade Idea Alerts: http://www.GoldAndOilGuy.com


