


Bad Weather To Blame?
Recent economic numbers and earnings projections have come in on the soft side. If the rationale below holds water, we have nothing to worry about. From MarketWatch:
Once again, the U.S. economy appears to have slowed in the first quarter. And once again the fault has fallen on several major snowstorms and periods of frigid temperatures that afflicted much of the country in late January and February. That kept consumers away from retail stores during typically busy shopping hours and prevented builders from starting new construction projects, among other things.
Objective View Of Market Risk
There are many ways to attempt to quantify risk in the stock market. Regardless of whether or not you believe in technical analysis, we know one thing with 100% certainty...we cannot start a new bear market until stocks make a lower high and a lower low. For example, the weekly moving averages shown below made a discernible lower high (near point A) followed by a discernible lower low (near point B) when the S&P 500 was still trading over 1,400 (it eventually fell to 666).

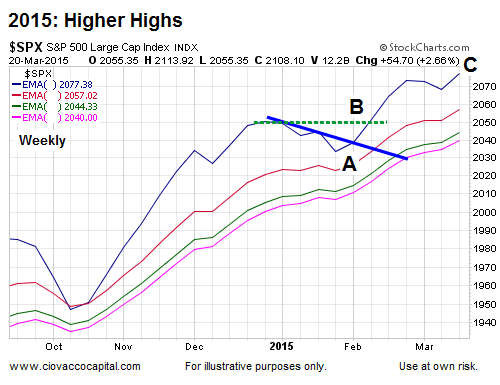
How Does The Same Chart Look Today?
Instead of making a lower low, the same moving averages recently broke above a downward-sloping trendline (near point A below), made a higher high (point B), and last week posted another higher high (point C). Recent market action tells us the aggregate opinion of all market participants is much more favorable today than it was in late 2007.
A More Detailed Look
This week's video looks at the stock market from numerous perspectives to assess risk and potential reward.
Investment Implications - The Weight Of The Evidence
Our market model will begin to reduce equity exposure when the hard data and observable evidence begins to deteriorate. The lower low in December 2007 is an example of observable bearish evidence. Based on the evidence in hand, we continue to hold an equity-heavy allocation. With inflation data, durable goods, and GDP coming later this week, we will observe with a flexible and open mind.


