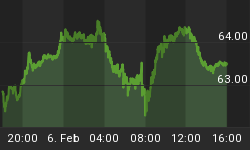
Since the beginning of January 2014 stocks have shown signs of institutional selling. This can be seen in the small capitalization stocks index the Russell 2000. This group of stocks generally leads the S&P 500.
Most bull market tops in the S&P 500 shown below take 8-12 months to form before it starts to fall in value. So far the market has been under distribution selling meaning the large traders (institutions, hedge funds) is selling their positions to the average investor to be left holding the bag when things go south.
The chart posted below shows some of my analysis of the SP500 index. This chart shows the 200 day moving average which is a great indicator of the major trend of the market. Green means bull market, red indicates bear market.
Also you will see the red ATR (Average True Range) indicator at the bottom. This tells us if the average daily movement for the index is high or low. When this red area rises we know there is a large amount of money flowing in and out of the equities market. It takes large amounts of capital to do this and is why the sellers are most likely hedge funds and institutions rebalancing their portfolios for an upcoming trend change.
If we step back and take a look at the bigger picture using the monthly chart of the S&P 500 we can foresee what is likely to happen in the next 12-36 months. The US stock market is losing momentum which can be seen by the relative strength indicator at the top of the chart.
Also the support trend line give us a feel on how soon a breakdown in price may happen. It appears to be just months away...
Taking things one large step further back, roughly 70 years you can see some patterns of that in the past. The question is not will there be a bear market, but how far will it correct?
The cart below shows a very bullish outlook of a minor correction of 30% in the next 36 months. Also I do have analysis that shows that if we break below the 30% level we could have a 50-60% correction which could trigger a chain reaction of issues including the US bond bubble to burst.
US Stock Market Conclusion:
In short, the US stock market continues to grind higher but with several warning signs to investors who know how to spot them.
There are three ways to play a bear market. The first is to do nothing, which is what most people do as they watch their life savings slowly evaporate right in front of them month after month.
Second, is to liquidate a large portion of equities and sit safely in cash while others lose money.
The third and last is to position yourself to profit from a falling market. It's known that stocks fall 4-7 times faster than they rise, which means you can potentially make 7 years' worth of profits in just 1-2 years if done correctly.
These are ways to play a bear market, and I say play because you do need to be a little more active to enter and lock in profits in this market condition. This is something I can help you with through my trade alert newsletter.
Happy Trading!


