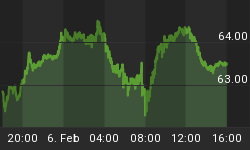
Gold did indeed bounce during the last two weeks and managed to post an impressive recovery. My model did a great job and helped me to create some nice profits in my short-term Gold trading. Unfortunately Thursday's candlestick is not really encouraging but momentum now is short-term bullish while the longer trend remains bearish. Until early summer the coming months typically will do everything to confuse you. Last year for example Gold moved sideways for many weeks only to shake out everybody with a final sell off before exploding $110 higher in just a few days. Overall there are no signs that the bear market is finally over. But the current recovery seems to have more time and space to go. Yet my model clearly identifies it as a bear market rally. If Gold manages to move above $1,265 and especially $1,300 the picture would brighten up dramatically.
Mines & Money Mauritius 2015
I have been invited to speak at the Mines & Money Mauritius Conference in June 2015 again. If you would like to join you can receive 25% off your delegate pass by using my discount code MP995SPK.
Midas Touch Gold Summary
During the last two weeks the model changed to a strong buy signal. The first buy signal that flashed was the GDX Daily-Chart followed by the Gold/Silver-Ratio. A very interesting development was the falling US Real Interest Rate. It went from 0.69% down to 0.49% within just 2 weeks. During the same timeframe Gold did exactly what it should do during falling real interest rates - it jumped $77.90 higher. Due to the fast recovery Sentiment is now neutral, while surprisingly the Gold CoT-Report is still very positive for Gold. Only the CoT-Data for Silver (which is not part of the model) has deteriorated significantly.
All in all the model is on a short-term buy signal and supports the view of an ongoing recovery towards $1,240.

Gold Daily Chart
After seven weeks of falling prices Gold finally found a bottom at $1,141. During the last two weeks bulls took over and pushed Gold back towards the 50-MA and the upper Bollinger Band. This massive resistance zone was too strong of course and led to an unhealthy looking candlestick on the daily chart. As the Stochastic indicator is getting overbought too we might see some form of a setback during the next couple of days. Momentum remains to the upside but Gold needs to make a higher low to create a new short-term up trend. While the longer term trend still is clearly down the positive CoT-Data suggests that the recovery has further to go at least.
As my model gave a buy signal the logic strategy for traders is to look out for a long-entry somewhere between $1,181 and $1,171. A tight stop can be placed at $1,157. Should Gold manage to recover towards $1,240/$1,250 I'd consider a short with a stop above $1,267 if the CoT-Data gives a sell signal.
The most promising strategy although remains to simply wait until May/June for the typical pre-summer bottom in Gold and the Gold stocks.
Investors had the chance to accumulate physical Gold below $1,150 and should wait for now. If Gold moves below $1,150 again continue to accumulate into weakness until you hold 10-20% of your net-worth in physical Gold and Silver as an insurance.
Long-term personal view
The return of the precious metals secular bull market is moving step by step closer and should lead to the final parabolic phase (could start in summer 2015 or 2016 and last for 2-5 years or even longer).
Before this can start Gold will need a final sell off down to $1,050-$980.
Long-term price target DowJones/Gold-Ratio remains around 1:1.
Long-term price target Gold/Silver-Ratio remains around 10:1 (for every ounce of gold there are 9 ounces of silver mined, historically the ratio was at 15:1 during the roman empire).
Long-term price target for Gold remains at US$5,000 to US$8,900 per ounce within the next 5-8 years.
Fundamentally, as soon as the current bear market is over Gold should start the final 3rd phase of this long-term secular bull market. 1st stage saw the miners closing their hedge books, the 2nd stage continuously presented us news about institutions and central banks buying or repatriating gold. The coming 3rd and finally parabolic stage will end in the distribution to small inexperienced new traders & investors who will be subject to blind greed and frenzied panic.


