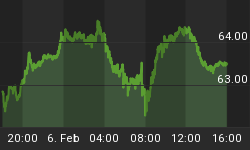
Inflowing Liquidity was in Expansion, with an up tick and stuck inside a triangle.
A quick look at the Inflowing Liquidity chart shows that Liquidity was in expansion, moving higher, and stuck in a triangular pattern.
It won't be inside that triangular pattern much longer, and when it breaks out, it will take the stock market in the same direction.


