• 1,013 days Will The ECB Continue To Hike Rates?
  • 1,013 days Forbes: Aramco Remains Largest Company In The Middle East
  • 1,015 days Caltech Scientists Succesfully Beam Back Solar Power From Space
  • 1,415 days Could Crypto Overtake Traditional Investment?
  • 1,419 days Americans Still Quitting Jobs At Record Pace
  • 1,421 days FinTech Startups Tapping VC Money for ‘Immigrant Banking’
  • 1,425 days Is The Dollar Too Strong?
  • 1,425 days Big Tech Disappoints Investors on Earnings Calls
  • 1,426 days Fear And Celebration On Twitter as Musk Takes The Reins
  • 1,427 days China Is Quietly Trying To Distance Itself From Russia
  • 1,428 days Tech and Internet Giants’ Earnings In Focus After Netflix’s Stinker
  • 1,432 days Crypto Investors Won Big In 2021
  • 1,432 days The ‘Metaverse’ Economy Could be Worth $13 Trillion By 2030
  • 1,433 days Food Prices Are Skyrocketing As Putin’s War Persists
  • 1,435 days Pentagon Resignations Illustrate Our ‘Commercial’ Defense Dilemma
  • 1,435 days US Banks Shrug off Nearly $15 Billion In Russian Write-Offs
  • 1,439 days Cannabis Stocks in Holding Pattern Despite Positive Momentum
  • 1,440 days Is Musk A Bastion Of Free Speech Or Will His Absolutist Stance Backfire?
  • 1,440 days Two ETFs That Could Hedge Against Extreme Market Volatility
  • 1,442 days Are NFTs About To Take Over Gaming?
What's Behind The Global EV Sales Slowdown?

What's Behind The Global EV Sales Slowdown?

An economic slowdown in many…

Another Retail Giant Bites The Dust

Another Retail Giant Bites The Dust

Forever 21 filed for Chapter…

How The Ultra-Wealthy Are Using Art To Dodge Taxes

How The Ultra-Wealthy Are Using Art To Dodge Taxes

More freeports open around the…

  1. Home
  2. Markets
  3. Other

This Past Week in Gold

SPDR Gold Trust Shares Daily Chart
GLD - on sell signal.


iShares Silver Trust Daily Chart
SLV - on buy signal.


Market Vectors Gold Miners Daily Chart
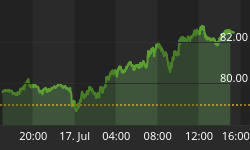
GDX - on buy signal.


XGD.TO Daily Chart
XGD.TO - on buy signal.


Central Fund of Canada Daily Chart
CEF - on buy signal.


HUI Gold Bugs Index Daily Chart

Gold stocks remained locked in a major down trend and until this trend is reversed, buyers beware.

Summary
Long term - on major sell signal since Mar 2012 when $HUI was at 550.
Short term - on mixed signals.
Gold sector cycle - up as of 4/10.
A corrective bounce is in progress.


Back to homepage

Leave a comment

Leave a comment