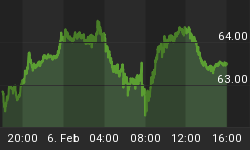
Although the overall trend is still down and the bears continue to be in control we can observe a bizarre apathetic Gold-market that is now sitting slightly below the $1,200 level. Neither bears nor bulls have been able to really make any decisive move let alone any progress.
The battlefield is clearly defined:
Any move below $1,170 should start a sharp sell off and could even trigger the long expected final capitulation towards $1,035. The bulls instead will gain momentum with any daily close above $1,210 and could light up a massive short squeeze if they can break through the heavy resistance zone around $1,220. Any price action between $1,175 and $1,205 therefore means just a continuation of the sideways trap.
But a big move is brewing. My personal preference is still kind of bearish but this outlook is simply missing its confirmation by Mr .Market. It would be very easy for the bears now but somehow I feel like the bulls might have a surprise for us....
Mines & Money Mauritius 2015
I have been invited to speak at the Mines & Money Mauritius Conference in June 2015 again. If you would like to join you can receive 25% off your delegate pass by using my discount code MP995SPK.
Midas Touch Gold Model Summary
The Model continues to be in strong Sell/Bearish Mode.
On the positive side we have a new buy signal due to the falling Volatility. Also and even more important the CoT-Report is now looking much better. This indicator is still missing quite some more commercial short covering to reach a really extreme constellation but the current one is already positive. A new sell signal happened last thursday on the GDX Goldminers Daily Chart. That's the only negative change.
After being neutral during most of April the model is currently in the second week of a bear signal and is pointing towards the typical sell off in May/June. At the same time a switch to a buy signal can now happen very fast. It only takes a move above $1,202 which is less than $15 or 1.1% away.

Gold Daily Chart
After eight weeks of grinding sideways movement there is quite some pressure in the Gold-market and Gold could explode either way anytime. The Bollinger Bands are as tight as they have been in last august. So a big move is coming and likely very close.
I have been emphasizing the bear case but due to the improved CoT-Data and the shrinking volatility a rally in Gold is getting more and more probable. My model is still bearish and I don't think that this rally would finish the overall bear market but it could collect enough enthusiastic passengers around $1,245 for the final "pain-train" towards $1,035.
As written above $1,210 is the first confirmation level for this scenario. At the same time the bear scenario is still possible too and should become reality as soon as Gold moves below $1,175 again.
Traders should avoid the sideways trap! To profit from the coming big move you could use a buy stop above $1,205/$1,210 to catch any bullish advance and at the same time place a sell stop at $1,170/$1,175 to ride the wave down. In between these numbers you are trading only noise. Let's wait and let the market decide.
As an investors I suggest you wait for another chance to accumulate physical Gold below $1,150 until you hold 10-20% of your net-worth in physical Gold and Silver as an insurance .
Long-term personal view
The return of the precious metals secular bull market is moving step by step closer and should lead to the final parabolic phase (could start in summer 2015 or 2016 and last for 2-5 years or even longer).
Before this can start Gold will need a final sell off down to $1,050-$980.
Long-term price target DowJones/Gold-Ratio remains around 1:1.
Long-term price target Gold/Silver-Ratio remains around 10:1 (for every ounce of gold there are 9 ounces of silver mined, historically the ratio was at 15:1 during the roman empire).
Long-term price target for Gold remains at US$5,000 to US$8,900 per ounce within the next 5-8 years.
Fundamentally, as soon as the current bear market is over Gold should start the final 3rd phase of this long-term secular bull market. 1st stage saw the miners closing their hedge books, the 2nd stage continuously presented us news about institutions and central banks buying or repatriating gold. The coming 3rd and finally parabolic stage will end in the distribution to small inexperienced new traders & investors who will be subject to blind greed and frenzied panic.


