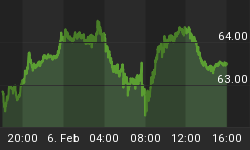
The chart below shows a Point & Figure chart of the Institutional Investor "core holdings".
What is it showing?
It is showing that the Institutional "core holdings" is moving up, but is about to reach and test a resistance level going back to November 2014.
It has tested this level 4 times before and pulled back afterwards. That will make this an important test level as we need to see a breakout above the resistance line or we will be facing a pull-back in the market.


