


Graceland Updates 4am-7am
June 9, 2015
- Please click here now. That's a seasonal chart for gold. I've highlighted my key buying and profit booking areas.
- June is the most important time of the year to buy gold.
- Unfortunately, by the time this vital month gets underway, most gold analysts and investors are too afraid to take any action.
- They are forced to buy at much higher prices. Religion-oriented buying in India pushes gold relentlessly higher into August and September, in what is typically the year's most powerful rally.
- This has happened for decades. Clearly, the more things supposedly change, the more they stay the same.
- Timid investors tend to fail, and brave ones tend to prosper. That's a key part of " financial life", and I don't see any event on the horizon that will change it.
- Technically, gold's daily chart is in " textbook" sync" with seasonality. Please click here now. Note the fabulous position of my 14,7,7 series Stochastics oscillator, at the bottom of the chart.
- Gold also tends to sell off going into the US jobs report, and then rally nicely in the days following the report.
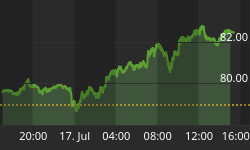
- On that note, please click here now. That's the hourly bars chart for gold, with Friday's " jobs report low" highlighted.
- Contrary opinion is a key indicator I use to suggest whether the next trending move is up, down, or sideways. I would estimate that about 70% of gold analysts are too afraid to buy any gold right now . That's the kind of number that typically fuels solid gold price rallies!
- Amateur investors need to think carefully about how to apply contrary opinion to their own investing. Most investors are usually wrong about market direction. Thus, it's important for the amateur investor to bet against their own analysis. That's a hard thing to do, but it's a critical part of successful investing.
- Please click here now. That's the daily chart of the US dollar versus the Japanese yen. The price action of this currency cross has historically been a key indicator of future gold price action.
- My Stochastics sell signal in play on that chart should provide comfort for the professional investor who buys gold in June. As China and India play an ever-bigger role in daily gold price discovery, the importance of this dollar/yen chart is waning.
- For now, it's still a decent gold price forecasting tool, and it suggests a nice gold rally is beginning!
- Please click here now. That's the Dow Transports monthly chart. Horrifically, when I look at it, the story of Icarus comes to mind.
- Rules aren't made to be broken, and Dow Theory has certain rules that are time-tested. When the Dow Transports disintegrate, it's a dire warning for global stock market investors.
- Note the emerging sell signal on the TRIX indicator on that Transports chart. The key 5,15 moving average series is also verging on a massive sell signal.
- Please click here now. It's imperative that Janet Yellen hikes rates soon. The " real" economy has been disintegrating since the late 1990s, because money velocity has been tumbling since then.
- QE only added to the deflationary fire. The money supply has been dramatically enlarged because of QE, but the banks need higher rates as an incentive to make aggressive loans to businesses. Until Janet hikes rates, M2V will continue to languish, and so will the economy.
- Also, America's population is aging. Savers have been destroyed by the low interest rates. Only the US government has really benefited from these rates, as it has been able to expand exponentially in size, like a bully expanding his reach on a school playground.
- The technical deterioration of the Dow Transports suggests that Janet's patience with government over-spending and size is wearing thin. The market appears to be anticipating rate hikes. The US government is becoming the single largest component of the US economy. Horrifically, the main product of the American empire is now red tape. Janet makes her next FOMC announcement on June 17. I doubt she hikes rates then, but I hope she does.
- Borrowing costs will rise for the US government as Janet hikes rates, and I'll clap enthusiastically as she makes that move. Global stock markets could crash, but the only way to raise the employment participation rate and the inflation rate is to increase the velocity of money.
- All roads lead to gold, silver, and gold mining/jewellery stocks, in the coming reflationary era. Please click here now. That's the daily chart for silver. Look at the position of my Stochastics oscillator, with lead line at nine! Silver is my favoured metal in the " reflationary era".
- Please click here now. That's the GDXJ chart. It's no secret that junior gold and silver stocks are the darling of the Western gold community. Arguably, America was built by men and women in overalls, and destroyed by bankers wearing suits. Junior gold mining companies give investors a chance to relive what made America an empire, and bet against what is probably going to burn it down. From a short term technical perspective, GDXJ looks spectacular. Note the bullish hook appearing on my Stochastics oscillator. Gold stocks swoon going into June, much like America swooned going into the year 1776. Was America a buy in 1776? Are gold stocks a buy in June? The answer to both questions is obviously... yes!
Special Offer For Website Readers: Please send me an Email to freereports4@gracelandupdates.com and I'll send you my free "GDX Blastoff!" report. I highlight the GDX chart, and how to play the leading stocks in in, for additional gains!
Thanks!
Cheers
st


