


With gold having broken out to a new high, there is naturally a marked increase in interest in the sector. However, when you look at the gold stock indices and at many of the larger gold stocks they are quite seriously overbought now. So what do you do? - buy because gold has broken out to a new high?, sell the large golds if you're holding because they've gone up a lot?, rotate into smaller issues? The purpose of this article is to address this issue. A subscriber holding Goldcorp and Royal Gold summed up this dilemma rather neatly a few days ago when he said that he was tempted to lock in substantial profits made on the recent run, but scared of missing out on a really strong advance if gold really takes off now. We'll now go through the charts to see what's going on.

Starting with the 1-year HUI GoldBUGS index chart, we see the sharp rise this month that at yesterday's intraday high resulted in a close to 50 point, or 25% gain in the index in the space of few weeks. An impressive rise that has resulted in it approaching critically overbought levels, that at best is likely to lead to a period of consolidation. It was pointed out some weeks ago on the site that the big golds would be the ones to go for as the HUI index makes a run at its earlier highs towards 260, and this has proved to be the case. The strong advance has resulted in the 50-day moving average rising up through the 200-day, a positive development, but note that the index is now way ahead of the 200-day, which is still flat, increasing the chances of consolidation/reaction at this juncture.

As we want to see where the index stands in relation to its earlier peaks we will now look at the 3-year HUI chart. A glance at this chart quickly reveals that the index has risen steeply into a zone of heavy resistance in the 250 - 260 area, and we will therefore obviously want to see a period of consolidation or a reaction around the present level in order for the current short-term overbought to unwind, otherwise, a break to new highs is unlikely to get very far. The price/volume action on the charts of the large golds indicate that that is precisely what we are about to get. The resistance at these highs is very considerable, so once the index succeeds in taking them out it will be a very bullish development that is expected to lead to a major across the board uptrend in gold stocks.
Now we will look at the charts of a couple of the large golds, with particular reference to volume, in an effort to determine if this steep uptrend has further to go, or if it has run its course, and a period of consolidation/reaction is necessary before further gains can be expected.

The chart for Goldcorp shows impressive gains that have resulted in a big gap with its moving averages - and a big gap between its moving averages, a situation which usually leads to a reaction. The risk of a reaction, already great due to the overbought condition has been greatly increased by the "Reversal Day" yesterday, when the price fluctuated over a wide range, and went on to close near the low, on very heavy turnover. This is normally a "That's all folks" signal, that ushers in a reaction.

The chart for Royal Gold is similar to Goldcorp, except that it went parabolic and became even more overbought. These 2 charts, and various other large gold charts, are signalling a probable period of consolidation or reaction in the weeks ahead.
The picture for the smaller to mid-cap stocks is very different because, although they are showing signs that they will consolidate/react along with the large caps, they are nowhere near as overbought, and therefore unlikely to react all that much. Furthermore, there is plenty to go for with these stocks when do get going again, which means that they should be bought on any pullback in coming weeks.
A good example of one of these small to mid-cap stocks is Bema Gold, and we will now take a look at the 1-year chart of it, in order to compare it to the charts for Goldcorp and Royal Gold shown above, and a 10-year chart to gain an overall perspective and assess its potential.

The 1-year chart for Bema Gold shows that it is nowhere near as overbought as many of the big golds, with a relatively modest gap with its moving averages. However, like many of its larger brethren it appears to had a Reversal Day yesterday, on very heavy volume, as those locked in earlier at higher levels took the opportunity to bail out at a better price.

The 10-year chart for Bema looks very positive, with the action from late 2003 to the present looking like the Handle of a giant Pan and Handle formation. If true then a major advance can be expected to follow an upside breakout from this pattern.

Another example of a more modest sized company whose stock is turning up and has a lot of upside potential is Miramar Mining. The 1-year chart does not reveal much of interest, so instead we will start with a 3-year chart. On this chart it can be seen that the price broke out above the 3rd fanline of a 3-arc fan correction last March, but then it deceptively fell to a new low in May, but found support above the 3rd fan line. This often happens with these fan lines, but it would have taken courage to buy at that point. This fanline correction appears to be a downsloping Handle to complement the large Pan, both of which can be seen on the 10-year chart. This is a fine example of a Pan base, although the Handle that followed the strong rally out of the Pan slopes down to an unusual degree. The signal for a strong rally in Miramar will be a break above the important resistance at $1.50 highlighted on the 3-year chart.

So the answer to the question posed at the start of this article is to rotate, or partially rotate, out of large cap golds and into the smaller and mid-caps. These are the stocks that should perform best once the HUI breaks out above 260, and the small cap and exploration issues can be expected to take off towards the end of the next intermediate uptrend. New buyers are expected to be able to enter the smaller and mid-caps at somewhat better prices in the days and possibly weeks ahead. To give examples of the sort of corrections we can expect in these stocks, Bema is a buy in the $2.50 area and Miramar in the $1.25 area.
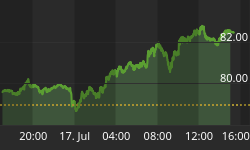
We will end with the 1-year chart for gold itself which looks good, although in need of a breather after the recent strong advance. This is what is expected to trigger the reaction in the gold stocks, especially the larger ones.

We will be looking at more of these mid-cap stocks on www.clivemaund.com in the near future.


