• 819 days Will The ECB Continue To Hike Rates?
  • 819 days Forbes: Aramco Remains Largest Company In The Middle East
  • 821 days Caltech Scientists Succesfully Beam Back Solar Power From Space
  • 1,221 days Could Crypto Overtake Traditional Investment?
  • 1,226 days Americans Still Quitting Jobs At Record Pace
  • 1,228 days FinTech Startups Tapping VC Money for ‘Immigrant Banking’
  • 1,231 days Is The Dollar Too Strong?
  • 1,231 days Big Tech Disappoints Investors on Earnings Calls
  • 1,232 days Fear And Celebration On Twitter as Musk Takes The Reins
  • 1,234 days China Is Quietly Trying To Distance Itself From Russia
  • 1,234 days Tech and Internet Giants’ Earnings In Focus After Netflix’s Stinker
  • 1,238 days Crypto Investors Won Big In 2021
  • 1,238 days The ‘Metaverse’ Economy Could be Worth $13 Trillion By 2030
  • 1,239 days Food Prices Are Skyrocketing As Putin’s War Persists
  • 1,241 days Pentagon Resignations Illustrate Our ‘Commercial’ Defense Dilemma
  • 1,242 days US Banks Shrug off Nearly $15 Billion In Russian Write-Offs
  • 1,245 days Cannabis Stocks in Holding Pattern Despite Positive Momentum
  • 1,246 days Is Musk A Bastion Of Free Speech Or Will His Absolutist Stance Backfire?
  • 1,246 days Two ETFs That Could Hedge Against Extreme Market Volatility
  • 1,248 days Are NFTs About To Take Over Gaming?
  1. Home
  2. Markets
  3. Other

Increased Risk Levels ...

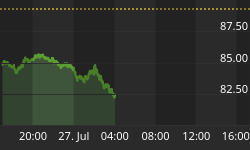
The VIX (see the chart below) is showing increasing stress levels.

Note that the VIX has risen above the blue dotted resistance line level. Since the VIX moves opposite to the stock market, this was a bad event on Monday.

However, the big risk for the VIX would be if it went above the (higher) red dotted resistance line. That level is a resistance line that goes back 3 and 1/2 years and would bring a lot of carnage should the VIX move above that level.

VIX Chart


Back to homepage

Leave a comment

Leave a comment