


The week started off hectic for the markets as news hit that Greece had closed its banks for the week and would miss a debt payment to the International Monetary Fund. News of a Puerto Rican default didn't help. Strengthening numbers in Housing and solid but not spectacular Jobs data did little to boost equities. Lackluster vehicle sales also did not help move stocks. A lack of inflation will be the weight around the neck of a potential rate hike in September and the release of Fed minutes next week should provide some clarity on their thoughts. Stocks ended this week down as Greek debt concerns held the markets hostage. For the week, the S&P 500 posted its largest weekly loss since the last week of March at 1.2% and the Blue Chip-heavy Dow Jones Industrial Average's fell 1.2%. The Nasdaq was also off 1.2% and the small cap Russell 2000 Index led losses falling almost 3%.
You can see in the chart below how at mid-year, despite making a number of record highs this year, the S&P 500 index is up just 0.2% while the Dow Jones industrial average is down 1.1%. What has to be a worrisome sign for market watchers is the Russell 2000 Index leading the recent price pullback. The small cap index led the market higher since the beginning of May. If the Russell 2000 continues to fall fast it can be expected to pull the larger stock indexes down as well.

A tool to help confirm the overall market trend is the Bullish Percent Index (BPI). The Bullish Index is a popular market "breadth" indicator used to gauge the internal strength/weakness of the market. It is the number of stocks in an index (or sector) that have point & figure buy signals relative to the total number of stocks that comprise the index (or sector). So essentially it is the percentage of stocks that have buy signals. Like many of the market internal indicators, it is used both to confirm a move in the market and as a non-confirmation and therefore divergence indication. If the market is strong and moving up, the BPI should also be moving higher as more and more stocks are purchased.
Last week we said "...If the Nasdaq Composite BPI does break into a downtrend along with the other major indexes, then this will confirm the market is pulling back...If the downtrend is confirmed expect the overall stock market to stall..." The updated chart below confirms this analysis is valid as the BPCOMPQ is in a confirmed downtrend.

The updated chart below presents a strong negative for the overall stock market. When both the DOW Industrial Average and DOW Transport Index move in the same direction, technicians consider this confirmation of the prevailing trend. As equity indexes vacillate in a trading range, the move is strongest when stocks are falling.

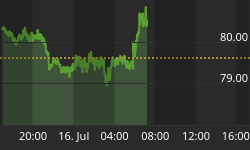
Money is starting to move into the safety of Treasuries as the dollar climbed to a three-week high before a government jobs report that may support Federal Reserve moves toward higher interest rates. The greenback advanced versus all of its major peers as a private survey showed American companies boosted employment in June, before the Labor Department report due Thursday. Gold prices fell as better-than-expected employment and manufacturing data out of the US took the shine off the metal. "The combination of investors not looking for gold as a safe-haven and a stronger dollar seems to be weighing on prices," said William Adams, head of research at Fastmarkets. The gold market has decisively shrugged off the worsening Greek debt crisis.

Market Outlook
U.S. stocks will probably continue to grind higher, aided by an improving economy and corporate earnings as well as more share buybacks from companies. But there will be headwinds from fears of rising interest rates and above-average valuations and shocks like the Greece debt crisis or a hard landing in China. But expect more volatility and pullbacks. Despite touching all-time highs in late May, the stock market has basically been "treading water (rather) than moving sharply higher, and we expect more of the same in the second half of the year," Liz Ann Sonders, chief investment strategist at Charles Schwab, said in the firm's mid-year outlook. "We expect the market to move gradually higher but with the ... possibility of more frequent pullbacks," Sonders warned.

A standard chart that we use to help confirm the overall market trend is the Momentum Factor ETF (MTUM) chart. Momentum Factor ETF is an investment that seeks to track the investment results of an index composed of U.S. large- and mid-capitalization stocks exhibiting relatively higher price momentum. This type of momentum fund is considered a reliable proxy for the general stock market trend. We prefer to use the Heikin-Ashi format to display the Momentum Factor ETF. Heikin-Ashi candlestick charts are designed to filter out volatility in an effort to better capture the true trend.
Last week's analysis is validated in the update chart below "...The major indexes will probably trade range bound heading into quarterly earnings..." As indicated in the chart all the technical signals point to neutral range-bound trading.

The CBOE Volatility Index (VIX) is known as the market's "fear gauge" because it tracks the expected volatility priced into short-term S&P 500 Index options. When stocks stumble, the uptick in volatility and the demand for index put options tends to drive up the price of options premiums and sends VIX higher. Stocks took a dump this week as option volatility exploded higher. The CBOE Volatility Index (VIX) rose 20% and may remain strong early next week after Greece's referendum vote on Sunday. The benchmark S&P 500 Index sank and bounced off its 200-day moving average, which should provide some near-term support.

The updated Put/Call ratio shows traders are definitively neutral about the short term market direction as they have invested in an equal number of calls and puts.

The American Association of Individual Investors (AAII) Sentiment Survey measures the percentage of individual investors who are bullish, bearish, and neutral on the stock market for the next six months; individuals are polled from the ranks of the AAII membership on a weekly basis. The current survey result is for the week ending 7/1/2015. The most recent AAII survey showed 42.30% of investors polled have a neutral outlooks for the market for the next six months, while 22.60% are bullish and 35.10% bearish. Retail investors remain cautious and content to mostly sit on the sidelines. As a contra indictor the current chart signals stocks should move back to recent highs.

The Nation Association of Active Investment Managers (NAAIM) Exposure Index represents the average exposure to US Equity markets reported by NAAIM members. The blue bars depict a two-week moving average of the NAAIM managers' responses. NAAIM member firms who are active money managers are asked each week to provide a number which represents their overall equity exposure at the market close on a specific day of the week, currently Wednesdays. Responses can vary widely as indicated below. Responses are tallied and averaged to provide the average long (or short) position or all NAAIM managers, as a group. As the name indicates, the NAAIM Exposure Index provides insight into the actual adjustments active risk managers have made to client accounts over the past two weeks. Second-quarter NAAIM exposure index averaged 72.84%. Last week the NAAIM exposure index was 58.96%, and the current week's exposure is 54.84%. Equity exposure remains relatively low, as Money Managers are nervous heading into earnings season.

Trading Strategy
The stock market has seen net outflows every week since late February and investors are buying call options on the Volatility S&P 500 Index (VIX) as if it's early 2008 and they know what's around the corner. But don't get the wrong idea. Only a very small percentage of people are shorting stocks. The majority of these investors are buying options to hedge their stock positions. Earnings season unofficially begins on Wednesday with the release of a quarterly report from Alcoa. We will see much more action on earnings the following week with Bank and Technology sectors

Feel free to contact me with questions,


