• 702 days Will The ECB Continue To Hike Rates?
  • 702 days Forbes: Aramco Remains Largest Company In The Middle East
  • 704 days Caltech Scientists Succesfully Beam Back Solar Power From Space
  • 1,104 days Could Crypto Overtake Traditional Investment?
  • 1,108 days Americans Still Quitting Jobs At Record Pace
  • 1,110 days FinTech Startups Tapping VC Money for ‘Immigrant Banking’
  • 1,113 days Is The Dollar Too Strong?
  • 1,114 days Big Tech Disappoints Investors on Earnings Calls
  • 1,115 days Fear And Celebration On Twitter as Musk Takes The Reins
  • 1,116 days China Is Quietly Trying To Distance Itself From Russia
  • 1,117 days Tech and Internet Giants’ Earnings In Focus After Netflix’s Stinker
  • 1,121 days Crypto Investors Won Big In 2021
  • 1,121 days The ‘Metaverse’ Economy Could be Worth $13 Trillion By 2030
  • 1,122 days Food Prices Are Skyrocketing As Putin’s War Persists
  • 1,124 days Pentagon Resignations Illustrate Our ‘Commercial’ Defense Dilemma
  • 1,124 days US Banks Shrug off Nearly $15 Billion In Russian Write-Offs
  • 1,128 days Cannabis Stocks in Holding Pattern Despite Positive Momentum
  • 1,128 days Is Musk A Bastion Of Free Speech Or Will His Absolutist Stance Backfire?
  • 1,129 days Two ETFs That Could Hedge Against Extreme Market Volatility
  • 1,131 days Are NFTs About To Take Over Gaming?
Is The Bull Market On Its Last Legs?

Is The Bull Market On Its Last Legs?

This aging bull market may…

How The Ultra-Wealthy Are Using Art To Dodge Taxes

How The Ultra-Wealthy Are Using Art To Dodge Taxes

More freeports open around the…

Billionaires Are Pushing Art To New Limits

Billionaires Are Pushing Art To New Limits

Welcome to Art Basel: The…

  1. Home
  2. Markets
  3. Other

This Past Week in Gold

SPDR Gold Trust Shares Daily Chart
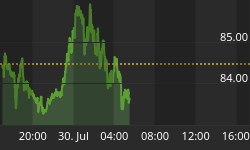
GLD - on sell signal.


iShares Silver Trust Daily Chart
SLV - on sell signal.


Market Vectors Gold Miners Daily Chart
GDX - on sell signal.


XGD.TO Daily Chart
XGD.TO - on sell signal.


Central Fund of Canada Daily Chart
CEF - new buy signal.


Gold Bugs Index Daily Chart

The $HUI 150 area is now major resistance, therefore, the lower prices can go during this sell off, the better potential return during the next tradable bottom.

Summary
Long term - on major sell signal since Mar 2012 when $HUI was at 550.
Short term - on mixed signals.
Gold sector cycle - down as of 5/16.
A tradable bottom should be in progress soon, be patient.


Back to homepage

Leave a comment

Leave a comment