US BreakEven Inflation at 5-Year Lows - by Ashraf Laidi - Aug 20, 2015
Neither higher than expected Philly Fed survey at 8.3 in August nor a dovish set of FOMC minutes has managed to ease the onslaught of selling in global equities. The old trick that a dovish Fed and poor data are good for stocks is no longer valid. An uncertain Fed drove down chances of a Sept Fed hike to 36% from close to 50% earlier in the week. Meanhwile, stock indices deepen their selloffs well after a series of DeathCrosses emerged in the S&P500, Dow-30, Dax-30, FTSE-100 and Shanghai Composite. which may suggest that they require the Fed to firmly shut the door on any 2015 rate cut.

We highlighted earlier on the week that the real impact on CPI remained to be seen after the latest downleg in oil prices. 0.2% y/y in the headline and 1.8% y/y on the core underlines the divergence caused by falling oil prices. This was seen in yesterday's release of UK CPI.
Breakeven inflation at 5-year lows
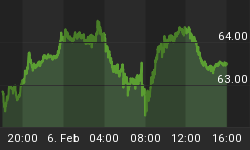
The above charts suggest market-oriented measures of inflation, such as break-evenrates, which measure the difference between traders' expectations of the differencebetween nominal bonds and inflation-protected bonds -- have fallen sharply. Unlikesurvey-based inflation measures, which are provided monthly, break-even ratesare available daily, with the 2-year BE tumbling to 7-month lows of 0.22% and5-year BE rates at 1.1%, the lowest since August 2010.These inflation measures have been criticized for being too sensitive to oil prices. But is the Fed being inadequately aware of falling oil prices? We warned here about how the Fed could be behind the curve in accounting for energy's impact on inflation.
We continue to expect the Fed to remain on hold in 2015, a positon long held since December 2014 . Our longs in EURUSD pre-NFP at 1.1020 remain open and our final target will not be lowered for now.


