


The following is part of Pivotal Events that was published for our subscribers August 20, 2015. "Widows and Orphans Sell": July 7.
Stock Markets
Considering all of the Fed stimulus and eternal deferral of the dreaded rate hike, action on the NYSE is not responding according to the recipe of asset inflation. Chronic accommodation is now about as effective as catnip on an 18-year old housecat.
The first bull market out of the Crash has ended in Shanghai and, quite likely, its bear has begun. On the way up it was following the explosive blow-offs as recorded by gold in 1980, the Nikkei in 1989, etc. It is following the "model" on the way down.
As the SSEC peaked in June, the next significant plunge would likely occur in the fall. This is the pattern on all of the great bubbles since the first one that completed in June 1720.
Not seeing any better-fitting pattern, we've used it to consider that some hot sectors in NY would reach speculative highs at "around" June. The senior indexes could be choppy during the summer, with the ultimate rally expiring in early September.
The basic theme is that once Shanghai completed, its failure would feed into the older financial capitals.
The conduit would be the course of credit spreads as through the fateful summers of 1998 (LTCM), 2007 (start of the contraction) and 2008 (you know what).
The most recent step on the path would be credit spreads breaking out in the first part of August. The worst with the crude oil panic was 213 bps in January. Wednesday's number was 220 bps which is a significant breakout.
Widening could soon become dramatic. In which case, all of the King's horses, all of the King's men and all of the King's central bankers will be unable to prevent the financial collapse.
The term "King" is deliberately used to imply the Divine Right of Bureaucrats.
Sector Comment:
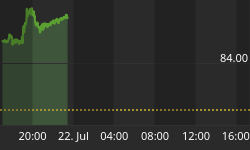
Banks (BKX) don't make big momentum peaks, but in 2007 their high did lead the SPX by a number of months. We published our "Widows and Orphans" sell on Wells Fargo on July 7th. It had accomplished the best rally and momentum in the sector. The study noted that as with the same advice in June 1998, it could take a couple of months to become effective.
BKX set its high in July, which was assisted by curve-steepening that ran from January to late June. The curve has been attempting to reverse.
Canadian banks set their high in April-May. RY declined from C$80 to 73 and bounced to 77. The slide to 74 is keeping the action below both the 50 and 200-Day moving averages.
It looks like the Canadian banks topped as the "rotation" for commodities completed in May. The sector is vulnerable to further weakening of commodities as well as deteriorating credit markets.
Broker-Dealers (XBD) may have had more fun in rallying from the key low of 74 in 2012. That was with that European crisis and it has been blase about the recent one. As noted in June, XBD had generated an RSI higher than reached in 2007. Of interest is that the 2007 high was set in June. This time around the June high was 202.98 and the high in July was 203.22. A false breakout.
The key in the 2007 failure was taking out the 50-Day ma in late June (Step One) and the 200- Day was taken out in late July.
This time around, Step One was accomplished in late June and Step Two (the 200-Day) was achieved yesterday.
Credit Markets
As noted above, US credit-spread widening has accomplished the critical breakout on the way to trouble. This changes the August (??) to August (![]() ) and is reviewed in the attached chart.
) and is reviewed in the attached chart.
The rally in long Treasuries worked out. Our latest target was 123 on the TLT and it made it to 125.71 last Wednesday. As noted last week, this accomplished a good swing in the RSI and had generated a "Sequential Sell" pattern. Traders were advised to flatten positions.
Municipals (MUB) have been trading with the TLT and accomplished a similar swing in momentum. The Sequential Sell (now with a Springboard Sell) on TLT could apply to the municipal bond market, which is becoming increasingly vulnerable to another round of defaults.
JNK rallied out of the year-end disaster from 37.26 to 39.65 in April. The decline to 37 yesterday has taken out the "disaster" low. The Weekly RSI is down to 24, which compares to 22 in December.
This could hold the market for a while, but it could go to very oversold in the fall.
US Credit Spreads: 2015

- The initial breakout was accomplished at 193 bps on June 29th.
- The critical breakout was achieved at 220 bps on August 19th.
- This is an important step, but not yet dramatic.
This compares to:
US Credit Spreads: 2008

- The initial breakout was accomplished at 300 bps on June 27.
- The critical breakout was achieved at 335 bps on August 7.
US Credit Spreads: 2007

- The initial breakout was achieved at 124 bps on June 30.
- The critical breakout occurred at 135 bps on July 20.
US Credit Spreads: 1998

- The initial breakout was at 104 bps, accomplished on July 1st.
- The deadly breakout was widening above 107 bps on July 30.
NYSE Advance/Declines

- This was one of our "Friends of the bull market".
- The peak was in April and using past examples the S&P would likely continue for a few months.
- Last week, we noted that the shelf life had expired and the guidance had ended.
- The decline is now much more extensive than the one into last October.
- It is more extensive than the one going into October 2007.
- Breaking to new lows this week suggests a cyclical bear market is inevitable.
Listen to the Bob Hoye Podcast every Friday afternoon at TalkDigitalNetwork.com
Link to August 21 Bob Hoye interview on TalkDigitalNetwork.com: http://talkdigitalnetwork.com/2015/08/equity-markets-beyond-central-bank-help/


