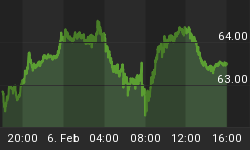
Current three waves up from the low is not telling us a lot as this rally can be wave 4) of a bearish impulse, or it can be start of a new larger recovery back to around 2050-2100 area. Seems like we will have to wait either on 1923 break (daily close price) that will put new bearish leg in play, or on overlap with 2056 when price will confirm a bullish turn for the S&P500.
S&P500 4h Elliott Wave Analysis

On intraday chart S&P500 made an overlap with 1923 with recent weakness which suggests that stocks could be headed lower again as rally from last week was made only in three waves. However, I would love to see a daily close price before we can confirm weakness. For the S&P500 the US trading hours will be important. US cash market just opened with S&P500, DOW and NASDAQ down nearly 2%.
S&P500 (Sep 2015) 1-Hour Elliott Wave Analysis

What Can You Get For 1€? At ew-forecast.com Try 1 Month Full Service >> http://www.ew-forecast.com/register
Want to receive more insights like these, free? We'd be happy to email them to you. Join our mailing list >> http://goo.gl/0KctEr


