• 287 days Will The ECB Continue To Hike Rates?
  • 287 days Forbes: Aramco Remains Largest Company In The Middle East
  • 289 days Caltech Scientists Succesfully Beam Back Solar Power From Space
  • 689 days Could Crypto Overtake Traditional Investment?
  • 694 days Americans Still Quitting Jobs At Record Pace
  • 696 days FinTech Startups Tapping VC Money for ‘Immigrant Banking’
  • 699 days Is The Dollar Too Strong?
  • 699 days Big Tech Disappoints Investors on Earnings Calls
  • 700 days Fear And Celebration On Twitter as Musk Takes The Reins
  • 702 days China Is Quietly Trying To Distance Itself From Russia
  • 702 days Tech and Internet Giants’ Earnings In Focus After Netflix’s Stinker
  • 706 days Crypto Investors Won Big In 2021
  • 706 days The ‘Metaverse’ Economy Could be Worth $13 Trillion By 2030
  • 707 days Food Prices Are Skyrocketing As Putin’s War Persists
  • 709 days Pentagon Resignations Illustrate Our ‘Commercial’ Defense Dilemma
  • 710 days US Banks Shrug off Nearly $15 Billion In Russian Write-Offs
  • 713 days Cannabis Stocks in Holding Pattern Despite Positive Momentum
  • 714 days Is Musk A Bastion Of Free Speech Or Will His Absolutist Stance Backfire?
  • 714 days Two ETFs That Could Hedge Against Extreme Market Volatility
  • 716 days Are NFTs About To Take Over Gaming?
Is The Bull Market On Its Last Legs?

Is The Bull Market On Its Last Legs?

This aging bull market may…

Billionaires Are Pushing Art To New Limits

Billionaires Are Pushing Art To New Limits

Welcome to Art Basel: The…

  1. Home
  2. Markets
  3. Other

Raj Time and Cycle review and Forecast 9/21/15

In my last public post, I was looking for a sharp decline 8/21-24 Low.

From the 8/22 Raj T&C weekend report : "From the 8/1-24L, we are expecting a few days sharp rally and another sharp decline."

Actual: We bottomed on 8/24L , reversed sharply for 4 days into Friday 8/28H , right at the 8/30 weekend Solar CIT.

From the 8/31 Raj T&C Daily Email : "We are rallying into the 8/30-31 Solar CIT, suggesting an 8/28-31 High. From there we see a choppy light volume decline into 9/4 Lows at the 9/3 Geo and 9/5 Solar CIT.

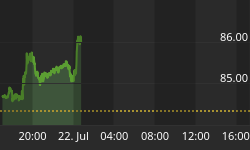
Actual: From the 8/28H we saw a choppy decline into 9/1 and 9/4 Lows. Since the 9/1L, we have been in a 2 week choppy triangle until last week.

From the 9/18 Raj T&C Daily Email:

S&P 500 Index @ SPRA $SPX D-D
Larger Image

9/17/15 was a major T&C Cluster swing High:

  1. The 9/16 double Apex CIT
  2. 9/17 FOMC and Mercury Retrograde
  3. The 9/18 Geometric Time CIT,
  4. 57 Squared weeks from 9/3/29H (+2)
  5. The active Cycle High.

The History and effect of 9/3/29 major High continues to date, credit goes to Mr. James Brock for first discovering this major Time square.

Major Time Squares from 9/3/1929H

  1. + 55 Squared weeks = 08/25/87H
  2. + 60 Squared weeks = 09/01/98L
  3. + 65 Squared weeks = 08/24/10L
  4. + 66 Squared weeks = 02/26/13L
  5. + 67 Squared weeks = 09/15/15H +2 = 9/17/15H

The active cycl e has been in the markets for some time and has pinpointed the 10/15/14 Crash Low and 8/24/15 crash Low and was looking for a 9/16 major High (+1), a 2 days decline into 9/18L, which we saw and now a 9/21 lower High.

What's next : We should make a 9/21 lower High (lower than 9/17H) and start a relatively sharp decline.


Back to homepage

Leave a comment

Leave a comment