
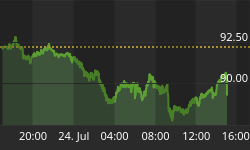
The September 11 break was support for the rally but has now become resistance. R.N. Elliott could count this chart a few different ways, but all counts point to lower prices.

Chart Courtesy of StockCharts
"No warning can save people determined to grow suddenly rich" - Lord Overstone
 |
Gold •752 days | 2,368.70 | +35.30 | +1.51% |
 |
Platinum •10 mins | 1,604.10 | -4.70 | -0.29% |
|
WTI Crude •1 day | 89.31 | -2.88 | -3.12% |
|
Gasoline •1 day | 3.396 | -0.101 | -2.87% |
|
Ethanol •752 days | 2.161 | +0.000 | +0.00% |
|
Silver •752 days | 30.82 | +1.16 | +3.92% |
 |
Silver • 752 days | 30.82 | +1.16 | +3.92% | |
|
Copper • 752 days | 4.530 | +0.111 | +2.51% | |
|
Brent Crude • 1 day | 96.78 | -3.91 | -3.88% | |
|
Natural Gas • 1 day | 2.871 | -0.045 | -1.54% | |
|
Heating Oil • 1 day | 4.181 | -0.161 | -3.71% |

Wells Fargo has done it…

More freeports open around the…

An economic slowdown in many…
The September 11 break was support for the rally but has now become resistance. R.N. Elliott could count this chart a few different ways, but all counts point to lower prices.
Sign up to the


