"No warning can save people determined to grow suddenly rich" - Lord Overstone
 |
Gold •742 days | 2,368.70 | +35.30 | +1.51% |
|
Platinum •10 mins | 1,676.30 | +34.60 | +2.11% |
|
WTI Crude •11 mins | 80.03 | +0.43 | +0.54% |
 |
Gasoline •13 mins | 3.298 | -0.003 | -0.10% |
|
Ethanol •742 days | 2.161 | +0.000 | +0.00% |
|
Silver •742 days | 30.82 | +1.16 | +3.92% |
 |
Silver • 742 days | 30.82 | +1.16 | +3.92% | |
|
Copper • 742 days | 4.530 | +0.111 | +2.51% | |
|
Brent Crude • 11 mins | 85.21 | +0.26 | +0.31% | |
|
Natural Gas • 11 mins | 2.902 | -0.022 | -0.75% | |
|
Heating Oil • 12 mins | 3.973 | +0.024 | +0.61% |
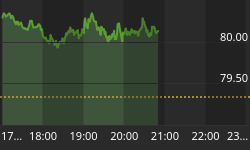
Chart of the Week

Contributor since: 26 Feb 2010
-
Deflation - Gauging The Risk
InvesTech Research Chart and commentary courtesy of: InvesTech Research Contrary to the Federal Reserve's fears, the widely respected Economic Cycle Research Institute contends that U.S.…
-
USD - Ready For a Rally
Possibly one more low first. Chart courtesy of StockCharts.com
-
USDollar/Trend Watch
This is not trading advice nor an advertisement. Prepared by: Rick McCoy
-
Selling Volume Again?
Chart Courtesy of StockCharts This is not trading advice nor an advertisement. Prepared by: Rick McCoy
-
16-Year Annualized Returns Since 1887
(Click Image to Enlarge - opens in new window)
-
No Volume = No Buyers
We would not be surprised by a stock market crash. Fewer and fewer buyers have participated over the past months. Certainly a bottom is not…
-
Inflation Watch
InvesTech Research InvesTech Research Recent months have seen this Future Inflation Gauge, tracked by the Economic Cycle Research Institute (ECRI), swing into it's steepest rise…
-
Volume Failed to Confirm the Rally
Chart Courtesy of StockCharts
-
A Rational Ending to the Bubble?
On the way down, bubbles always overshoot their launch point. There will be many rallies and false hopes of a new bull market, but the…
-
Utilities Break Their Neck
The breakdown of the Dow Jones Utility Average may be a leading indicator of severe credit problems facing the US. Chart Courtesy of StockCharts
-
NASDAQ 100 - Faithful To 911
The September 11 break was support for the rally but has now become resistance. R.N. Elliott could count this chart a few different ways, but…
-
Hold 9440 or Bust?
Important support for the DOW lies at 9430-9440. Chart Courtesy of Stockcharts
-
USD: Important Test Ahead
Chart Courtesy of Stockcharts
-
Too Many Bulls?
Sentiment has reached an extreme. A correction may be imminent. Chart Courtesy of Stockcharts
-
Long Term Interest Rates
Are Breaking Out to the Upside Chart Courtesy of Stockcharts
-
The Dow/Gold Ratio 1900 - 2001
Chart Courtesy of Sharelynx
-
Is Canada Forming the Right Shoulder?
Chart Courtesy of StockCharts
-
Is Canada Following Argentina?
Chart Courtesy of Economagic
-
What's Wrong, Utilities?
Cheap Oil, Cheap Money! Could it be credit risk? Chart Courtesy of StockCharts
-
Bonds In Their Final Surge?
The next sustantial move is down! Chart Courtesy of Stockcharts
Sign up to the
Safehaven Market Insider


