
The breakdown of the Dow Jones Utility Average may be a leading indicator of severe credit problems facing the US.

Chart Courtesy of StockCharts
"No warning can save people determined to grow suddenly rich" - Lord Overstone
 |
Gold •742 days | 2,368.70 | +35.30 | +1.51% |
|
Platinum •19 mins | 1,677.80 | +36.10 | +2.20% |
 |
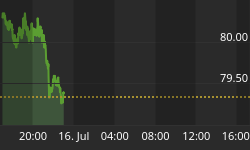
WTI Crude •11 mins | 79.55 | -0.05 | -0.06% |
|
Gasoline •15 mins | 3.286 | -0.015 | -0.46% |
|
Ethanol •742 days | 2.161 | +0.000 | +0.00% |
|
Silver •742 days | 30.82 | +1.16 | +3.92% |
 |
Silver • 742 days | 30.82 | +1.16 | +3.92% | |
|
Copper • 742 days | 4.530 | +0.111 | +2.51% | |
|
Brent Crude • 11 mins | 84.74 | -0.21 | -0.25% | |
|
Natural Gas • 11 mins | 2.904 | -0.020 | -0.68% | |
|
Heating Oil • 13 mins | 3.954 | +0.006 | +0.14% |

This aging bull market may…

During the quarter there were…

Forever 21 filed for Chapter…
The breakdown of the Dow Jones Utility Average may be a leading indicator of severe credit problems facing the US.
Sign up to the


