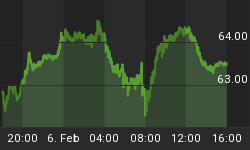
Curve Watcher's Anonymous points out 3-month treasury yields dipped briefly negative on several days recently.
Yield on the 3-month bond was negative again today. Here is a table I put together with Treasury Yield Quotes from Bloomberg.
Treasury Yields vs. Month and Year Ago

One could also use US Department of Treasury Daily Treasury Yield Curve Rates to produce an end-of-day view as opposed to the intraday snapshop above and chart below.
Yield Curve vs. Month Ago and Year Ago
Long End Flattening
The time line is not to scale, but the above chart still tells the correct story. In particular, note a negative rate at the front end and the flattening at the long end of the curve vs. a month ago and a year ago.
Economy Strengthening?
Three month treasuries should not be negative in a rate hike environment.
Yields at the short end of the curve, from 6-months to 2-years are slightly higher than a year ago, an indication of anemic hikes. But if hikes are coming, rates should not be lower than a month ago.
The yield on 6-month treasuries actually declined 19 basis point in past month.
Are hikes really coming?
Recession Warning
None of this should be happening in a rising rate environment with an allegedly strengthening economy.
In fact, action at the long end of the curve coupled with negative yields at the very front end is outright recessionary behavior.


