


Emotional Reaction To A Red Day
If you have been around the markets for any length of time, the following statements seem rational and logical:
- Stocks have green days and red days during a bull market.
- Stocks have green days and red days during a bear market.
- Stocks have green days and red days during a bullish rally.
- Stocks have green days and red days during a bearish correction.
And yet, the emotional reactions to a single red day and a single green day always seem to be extrapolated days, weeks, months, and years into the future.

Did Investors Sprint For The Exits On Tuesday?
Trading volume can provide some insight into investor conviction. Would we expect to see high trading volume after a bearish black swan event? Yes, unexpected bad news typically causes a rush for the exits.
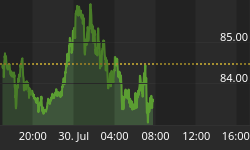
On October 8, the S&P 500 cleared prior resistance levels (a bullish outcome). On Tuesday, October 13, the S&P 500 "gave back" some of the recent gains by dropping 0.63%. Was volume higher on the red day or the green day? Answer: Volume was much lower on the red day. Final volume figures were not available at press time, but it appears as if SPY traded somewhere in the neighborhood of 83 to 90 million shares on Tuesday's down day, which is roughly 42% lower than SPY volume on the day of last week's bullish break above prior resistance. Volume may pick up in the coming days, but it was not alarming Tuesday.

Are There Things To Be Concerned About?
Yes, the S&P 500 stalled Tuesday near a logical area of possible resistance, earnings have been just okay, and the Fed continues their seemingly endless talk of this now-fuzzy concept of taking action. Having stated those points, Tuesday's low volume selloff does not discount the long list of bullish developments described in this week's video.
Stocks, Bonds, Or Both?
The improvement in the hard evidence since the October 2 intraday reversal in stocks cannot be disputed. The same can be said for the still-concerning and bearish longer-term trends. The evidence is mixed, and not surprisingly, the market is also voting in a mixed manner. As shown in the weekly chart of the S&P 500 below, the trend is trying to make a bullish turn, which is a reflection of waning fears about Armageddon.

Have all market participants bought into the "stocks are now the only place to be" theory? No, the weekly chart of intermediate-term Treasury bonds (IEF) also remains in a bullish uptrend. Bonds have two possible drivers: (1) a fear of bad things happening, and (2) the odds of the Fed hiking rates are lower today than a few months ago, which is good for bonds.

Investment Implications - The Weight Of The Evidence
The market's risk-reward ratio has seen improvement since the October 2 reversal, which is why our market model has called for some additional exposure to equities. Improvement and perfection are different concepts, which is why our allocations also include offsets in the form of bonds and cash. The bulls want any retest of the recent breakout levels between 1972 and 1995 on the S&P 500 to hold; bears want to see them taken out. The S&P 500 closed Tuesday at 2003.

We have two sets of conflicting data; before October 2 and after October 2. One set will carry the day. If we keep a flexible and open mind, the markets and hard data will help guide us over the coming weeks.


