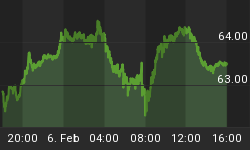
Walmart (WMT) didn't have its best day today. The bellwether retailer forecast a profit decline of 6-12% in its 2017 fiscal year, in some part because of a $1.5bln increase in wage expenses; the stock dropped 10% to its lowest level since 2012 and off about 33% from the highs (see chart, source Bloomberg).

I mention Walmart neither to recommend it nor to pan it, but only because in the absence of news from WMT I would have been inclined to ignore the modest downside surprise in Retail Sales today; September Retail Sales ex-auto-and-gasoline were unchanged versus expectations for a +0.3% rise. But Retail Sales, like Durable Goods, is a wildly volatile number (see chart, source Bloomberg).

This was a bad month, but it wasn't the worst month in 2015. It wasn't even the second or third-worst month in 2015. Looking at a monthly figure, it is difficult to reject any null hypothesis; put another way, you really cannot discern whether +0.5% is statistically different from +0.0%. [I didn't actually do the test...I am just making the general statistical observation.] Today's data will tweak the Q3 forecasts a bit lower, but isn't anything to be upset about. Except, that is, for the fact that Walmart is bleeding.
There is something else that is different about this decline, and really about this whole year. I have documented in the past the steady decline in equity volumes that has been occurring for almost a decade now. The chart below shows the cumulative NYSE volume, by trading day of the year, for 2006 through present. Note the steady march lower in volumes year after year after year. 2014 and 2013 were almost mirror images, so you can't see 2014. But notice the thicker black line: that is 2015.

Here is another way to illustrate the same thing. By year, here is the number of days that less than 1 billion shares traded in NYSE Composite Volume.
| Number of sub-billion share days | |
| 2005 | 4 |
| 2006 | 7 |
| 2007 | 7 |
| 2008 | 18 |
| 2009 | 35 |
| 2010 | 113 |
| 2011 | 166 |
| 2012 | 240 |
| 2013 | 246 |
| 2014 | 246 |
In 2015, we are on pace for a mere 228 sub-billion share days.
I guess by now my point is plain, but here is one more chart and that is the rolling 20-day composite volume for 2014 (lower line) and 2015 (upper line).

In general, volumes have been higher this year, but the real divergence began at the end of July, when the lines began to move away from each other more rapidly. The equity breakdown started on August 20th.
What does this all mean? Rising trading volumes while markets are declining suggests we should consider imputing more significance to what many are calling a correction but which may be the beginning of something deeper. There are re-allocations happening, and outright sales - not just fast money slinging positions around. Technically, this is supposed to put more weight on the "damage" done by this correction, and raise a bit of a warning flag about the medium-term set-up.
Incidentally, you can buy warning flags cheaply at Walmart.
You can follow me @inflation_guy!
Enduring Investments is a registered investment adviser that specializes in solving inflation-related problems. Fill out the contact form at http://www.EnduringInvestments.com/contact and we will send you our latest Quarterly Inflation Outlook. And if you make sure to put your physical mailing address in the "comment" section of the contact form, we will also send you a copy of Michael Ashton's book "Maestro, My Ass!"


