• 322 days Could Crypto Overtake Traditional Investment?
  • 327 days Americans Still Quitting Jobs At Record Pace
  • 329 days FinTech Startups Tapping VC Money for ‘Immigrant Banking’
  • 332 days Is The Dollar Too Strong?
  • 332 days Big Tech Disappoints Investors on Earnings Calls
  • 333 days Fear And Celebration On Twitter as Musk Takes The Reins
  • 335 days China Is Quietly Trying To Distance Itself From Russia
  • 335 days Tech and Internet Giants’ Earnings In Focus After Netflix’s Stinker
  • 339 days Crypto Investors Won Big In 2021
  • 339 days The ‘Metaverse’ Economy Could be Worth $13 Trillion By 2030
  • 340 days Food Prices Are Skyrocketing As Putin’s War Persists
  • 342 days Pentagon Resignations Illustrate Our ‘Commercial’ Defense Dilemma
  • 343 days US Banks Shrug off Nearly $15 Billion In Russian Write-Offs
  • 346 days Cannabis Stocks in Holding Pattern Despite Positive Momentum
  • 347 days Is Musk A Bastion Of Free Speech Or Will His Absolutist Stance Backfire?
  • 347 days Two ETFs That Could Hedge Against Extreme Market Volatility
  • 349 days Are NFTs About To Take Over Gaming?
  • 350 days Europe’s Economy Is On The Brink As Putin’s War Escalates
  • 353 days What’s Causing Inflation In The United States?
  • 354 days Intel Joins Russian Exodus as Chip Shortage Digs In
  1. Home
  2. Markets
  3. Other

USDCHF: Triangle Pointing To The Upside; Bullish Momentum Could Follow

USDCHF has been moving sideways since end of March. We see five price swings between two trendlines that reminds us on a triangle formation. That's a five wave A-B-C-D-E pattern that occurs in the direction of a trend, so it's a continuation formation that suggests more upside for USDCHF. In fact this bullish trend continuation may resume very soon after recent bounce from 0.9470 and towards the upper resistance line. Move from the last few days is sharp, so break above the trendline may not be far away which will confirm a bullish run for the USD against the Swiss Franc. We see 1.0000 coming, but then even 1.0300-1.0400 in months ahead.

USDCHF, Daily

USDCHF Daily Chart

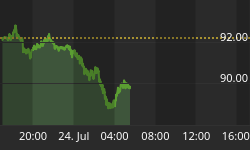
USDCHF has finally broken to the upside, out of a downward channel that lift prices up to 0.9740 as expected. We see current leg as wave (3) of a new bullish impulse so more gains should follow ahead, especially after a wave four pullback that can take place in the next few sessions.

USDCHF, 4H

USDCHF 4-Hour Chart

A Triangle is a common 5 wave pattern labeled A-B-C-D-E that moves counter-trend and is corrective in nature. Triangles move within two channel lines drawn from waves A to C, and from waves B to D. Triangles are overlapping five wave affairs that subdivide into 3-3-3-3-3.

Basic Triangle Pattern:

Idealized Basic Triangle Pattern


If you like our trading ideas, you can visit our website at --> www.ew-forecast.com
Want to receive more insights like these, free? We'd be happy to email them to you. Join our mailing list >> http://goo.gl/0KctEr


Back to homepage

Leave a comment

Leave a comment