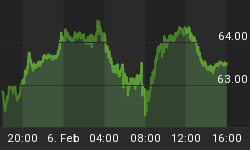
There's a nasty combination out there that says things won't be all that easy for a while but still nothing in the moment that says the bad news bear is about to get rocking. i still think that's a bit out there although not too far out there. The daily index charts hit 70 rsi for a few days. Fortunately they didn't get too overbought thus some selling makes sense at some point soon. Maybe a move down to an open gap on the Sp at 2052 to 2058. It's also possible that before we get the pullback we could test somewhat higher towards the old highs on the Sp at 2134. Not sure about that one. We're overbought enough to not make it all the way up there but no too overbought so we shall see. Ultimately I still believe a new high is likely before the good times come to a screeching halt and Mr. Bear takes over. The action today wasn't bad but in line with how a market would react to being at 70 rsi for a few days. it gets tougher and tougher to get sustainable upside once you get to that magical 70 level along with stochastic's well up in the 90's along with a very elevated Macd. So today was normal which also tells us we really shouldn't be aggressive with new plays for a while. Even if we do get towards the old highs it would be prudent to buy again with a bit of aggression once we get deeper selling to unwind things. For now the risk reward just isn't all that good for anyone. With the trend overall a bit higher but with the market at overbought you're getting more of that wonderful whipsaw. Best to keep it lighter for now.

Now for the reality check none of us want to face but have to if we're going to hold our own down the road. The worst looking monthly charts are staring down our throats. We can choose to try to and wish them away or we can do the right thing which would be to respect them. The message is clear as can be. The monthly index charts will print some of the worst looking negative divergences you've ever seen once we get to new highs. We don't need those new highs to understand how bad they are but once we get there over time, and I think we will, even if we pull back first, the market will have no chance for sustainable upside. Once those negative divergences take hold things should go down hill very rapidly and without much warning. The masses will get trapped is my belief. This is only my thinking. The market has to prove all of this to me by first distributing at tops followed my retail money or lighter volume back up. Once that process gets repeated a few times we'll know the game is officially over for the bulls. It's all a process. A very long process. An annoying one as well as no one gets instant gratification. I wish I could tell all of you that those divergences can go away quickly but to be blunt, they can't and likely won't. It could take well over a year. Impossible to tell and only when it's under way can we get a better grip on how this should unfold. In the mean time there's still time for new highs which again, I think will occur over time although some form of a pullback should occur soon.

When market index charts, daily index charts especially, are up near or at 70 rsi you don't need a negative divergence short or long term to tell you risk is on the rise until things unwind. Try to keep things simple. Can the rsi's on those daily index charts get above 70? Of course they can. There's no way to know what the final level will be but adhere to the rule of 70 and for the most part you'll have done yourself a big favor by not taking on new exposure. 70 rsi unto itself is not a sell signal but it is a highly precautionary signal. Just keep that in mind before you go out and get too overly exposed. However, because it's not a classic sell signal such as a negative divergence would be, it doesn't scream to go out and short either. 70 rsi in an up trend is a reminder that it's time to reign in aggression. Simple as that. Most of the time the market will sell a while at 70 rsi but not always. respect the game and you'll be fine. 2052/2058 gap is key support on any selling. 2134 is still resistance. Ever forward.
Please join us for a free 3 week trial at www.TheInformedTrader.com


