• 391 days Could Crypto Overtake Traditional Investment?
  • 396 days Americans Still Quitting Jobs At Record Pace
  • 398 days FinTech Startups Tapping VC Money for ‘Immigrant Banking’
  • 401 days Is The Dollar Too Strong?
  • 401 days Big Tech Disappoints Investors on Earnings Calls
  • 402 days Fear And Celebration On Twitter as Musk Takes The Reins
  • 404 days China Is Quietly Trying To Distance Itself From Russia
  • 404 days Tech and Internet Giants’ Earnings In Focus After Netflix’s Stinker
  • 408 days Crypto Investors Won Big In 2021
  • 408 days The ‘Metaverse’ Economy Could be Worth $13 Trillion By 2030
  • 409 days Food Prices Are Skyrocketing As Putin’s War Persists
  • 411 days Pentagon Resignations Illustrate Our ‘Commercial’ Defense Dilemma
  • 412 days US Banks Shrug off Nearly $15 Billion In Russian Write-Offs
  • 415 days Cannabis Stocks in Holding Pattern Despite Positive Momentum
  • 416 days Is Musk A Bastion Of Free Speech Or Will His Absolutist Stance Backfire?
  • 416 days Two ETFs That Could Hedge Against Extreme Market Volatility
  • 418 days Are NFTs About To Take Over Gaming?
  • 419 days Europe’s Economy Is On The Brink As Putin’s War Escalates
  • 422 days What’s Causing Inflation In The United States?
  • 423 days Intel Joins Russian Exodus as Chip Shortage Digs In
Is The Bull Market On Its Last Legs?

Is The Bull Market On Its Last Legs?

This aging bull market may…

Another Retail Giant Bites The Dust

Another Retail Giant Bites The Dust

Forever 21 filed for Chapter…

Billionaires Are Pushing Art To New Limits

Billionaires Are Pushing Art To New Limits

Welcome to Art Basel: The…

  1. Home
  2. Markets
  3. Other

Elliott Wave Analysis On GOLD And AUDUSD

Gold

Gold is still in recovery phase, resembling a triangle pattern. It is now trading in last stages of the triangle pattern in wave (e). Price in wave (e) could move towards 1080-1084 area, before turning to the downside into blackwave 5.
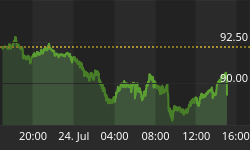
Gold, 1h

Gold 1-Hour Chart


S&P500

The same goes for S&P500, where price is trading in a traingle pattern,which now looks completed. That said more upside could follow in sessions ahead.

S&P500

A Triangle is a common 5 wave pattern labeled A-B-C-D-E that moves counter-trend and is corrective in nature. Triangles move within two channel lines drawn from waves A to C, and from waves B to D. Triangles are overlapping five wave affairs that subdivide 3-3-3-3-3.

Basic Triangle Pattern :

Idealized Elliott Wave Basic Triangle Pattern


If you like our trading analysis, you can visit our website at --> www.ew-forecast.com


Back to homepage

Leave a comment

Leave a comment