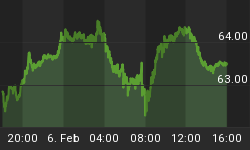
London Silver Fix Price: $14.11 (-$0.18 on week)
NYMEX Spot Price: $14.07 (-$0.12)
US Dollar Index: 100.08 (+0.48)
Silver RSI: 29.07 (+1.76) (70 overbought/30 oversold)
US Dollar RSI: 71.07 (+2.53) (70 overbought/30 oversold)
RMAR: 0.98 (+0.01) (1.30 overbought)
SLI: 0.670.68 (+0.01) (1.80 overbought)
GOLD SILVER RATIO: 75.25 (-0.77) (15 overbought)
(This is a copy of the latest weekend update sent to subscribers)
The battle lines are drawn and the fight for supremacy is drawn out along two lines.The first is the 100 line on the US Dollar Index. Since the 13th November, the dollar has meandered between 99 and 100 trying to push higher. The dollar now has reached the same level achieved in March 2015. The ingredients are there for a major double top as the RSI meanders in the low 70s and gold enters deeply oversold territory in terms of the dollar. By that I don't mean the usual technical indicators, but one I created recently which I call the Gold Leverage Indicator and which measures how gold performs in relation to the US Dollar Index. It measures that performance over an extended period and the graph is shown below with gold shown in green.

As you can see, the spikes and troughs over forty years tell a story of the dollar and gold going in opposite directions. However, though this gold leverage indicator does not seem a good tool for spotting tops in the gold market, note that it is currently at a bottom which has only been outdone by the lows of 1984 when gold hit the skids after the crash of 1980. Moreover, it is now at a bottom that has only been matched by another low in 2000, and we know what happened after that. According to this graph, gold cannot really go much lower against the US Dollar and the only direction is up.
Meanwhile, the gold price has finally hit the second battle line which is the lower line of the channel it has bounced around in since late 2013. Previous form suggests it does not hang around here for long and bounces back upwards. But channels are there to be broken out of, gold will not stay inside it forever. If the US Dollar Index significantly breaches 100, gold will break out of the channel and head south (or at best it would just follow the channel line downwards). If this is a US Dollar double top, then the next gold target is $1200 at the upper line.

As for silver, as said before, it is well above its channel bottom and continues to test its previous low of $13.97. For the time being, we will use the clearer dollar and gold metrics, knowing that silver will follow gold.


