


The prices of the metals moved mostly sideways this week. That is, until Friday. Then foom! (Foom is the sound of a rocket taking off.)
From 6 to 10am (Arizona time, i.e. 8 to 12 NY time) the price of gold rose from $1,061 to $1,087. Not surprisingly, the silver price rose a greater percentage, from $14.14 to $14.59.
The catalyst seems to be the Bureau of Labor Statics jobs report. There were a few more jobs created than expected, which means the economy is doing well and/or the Fed is more likely to raise interest rates this month (the Fed has said it is basing its decision on labor market conditions, among other indicators). Whatever it was, it lit the fuse and sent the silver price up 45 cents. It held this level, and this represents the entire silver price gain for the week.
Many readers have asked us what we think of technical analysis. Our challenge with it, is the attempt to predict future price changes from past price changes. This is especially so in the gold and silver markets, as there are such large stocks relative to flows. In gold, by official estimates, the stocks to flows is around 70 years. Compare this to ordinary commodities, where this ratio is more like 0.25 years.
Why do we mention stocks to flows in this context? The speculators are trying to move something of much greater inertia. While one could conceivably corner the market in rareearthium, it's impossible with gold or silver. Just ask Herbert and Bunker Hunt, or Warren Buffet.
The movement of stocks in and out of carry tells us about the speculators, because we can watch their impact on the basis. Speculators can push the price around -- temporarily. But they can't move it durably, because the hoarders are accumulating or decumulating much larger quantities. To use an analogy to flowing water, one could easily divert the water on one's driveway, but not a major river.
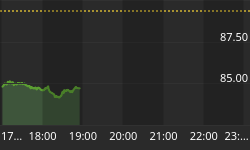
We will look at how Friday's price jump affected the silver term structure. But first, here's the graph of the metals' prices.
The Prices of Gold and Silver

We are interested in the changing equilibrium created when some market participants are accumulating hoards and others are dishoarding. Of course, what makes it exciting is that speculators can (temporarily) exaggerate or fight against the trend. The speculators are often acting on rumors, technical analysis, or partial data about flows into or out of one corner of the market. That kind of information can't tell them whether the globe, on net, is hoarding or dishoarding.
One could point out that gold does not, on net, go into or out of anything. Yes, that is true. But it can come out of hoards and into carry trades. That is what we study. The gold basis tells us about this dynamic.
Conventional techniques for analyzing supply and demand are inapplicable to gold and silver, because the monetary metals have such high inventories. In normal commodities, inventories divided by annual production (stocks to flows) can be measured in months. The world just does not keep much inventory in wheat or oil.
With gold and silver, stocks to flows is measured in decades. Every ounce of those massive stockpiles is potential supply. Everyone on the planet is potential demand. At the right price, and under the right conditions. Looking at incremental changes in mine output or electronic manufacturing is not helpful to predict the future prices of the metals. For an introduction and guide to our concepts and theory, click here.
Next, this is a graph of the gold price measured in silver, otherwise known as the gold to silver ratio. The ratio fell slightly this week.
The Ratio of the Gold Price to the Silver Price

For each metal, we will look at a graph of the basis and cobasis overlaid with the price of the dollar in terms of the respective metal. It will make it easier to provide brief commentary. The dollar will be represented in green, the basis in blue and cobasis in red.
Here is the gold graph.
The Gold Basis and Cobasis and the Dollar Price

The price of the dollar (i.e. the inverse of the price of gold, measured in dollars) continued its neat correlation with the cobasis (i.e. scarcity of gold). In other words, as the price of gold rises, it becomes less scarce on the market. As it falls, it becomes scarcer. This has been the market mode for quite a while now.
Friday's price action did not break the pattern.
Unfortunately, for gold bulls, with every tick up in price the decrease in scarcity is larger, and with every tick down in price, the increase in scarcity is smaller. In other words, our calculated fundamental price continues its slow slide which began the second week of September. That said, the fundamental price is still more than $100 over the market, just under $1200.
Now let's look at silver.
The Silver Basis and Cobasis and the Dollar Price

The same pattern also occurs in silver, and more. Last week, the March silver cobasis was near the same level as the February gold cobasis. Now it has fallen quite a bit more.
The fundamental price of silver also came down a bit, now a scant quarter above the market price.
Finally, let's take a look at what happened to the silver basis as the price rocketed up.
Three Snapshots of the Silver Term Structure

Think of the term structure of the basis like a yield curve for the bond market. The basis is the profit you can earn to carry silver, quoted as an annualized percentage. Since one can borrow dollars (often at LIBOR) to carry silver, the basis tends to be pretty close to LIBOR.
That said, we are interested in change at the margin.
This graph shows three snapshots. One was taken before the price began spiking, one was in the middle of it, and one was after. It is interesting to see that the greatest effect on basis occurred in the January contract, with the least on the December 2016 contract.
The graph clearly shows a dramatic increase in the basis, especially in the near contracts. Why is this significant?
Recall that basis is (to oversimplify -- for a full explanation, click here) the future price - spot price. There was a frenzy of buying that pushed up the silver price more than 3% in a few hours. That frenzy was not stackers lining up to buy phyz. It was speculators buying paper.
Why does that matter? Speculators, who typically use leverage, can't hold the market price against the tide of the hoarders. They can push for a while, but they have to close their positions sooner or later, either to take profits (as they reckon them, in dollars) or to stop losses.
There will come a day when the prices of the metals are rising due to insatiable demand for metal. As Aragorn would say, "Friday was not that day!"


