• 1,007 days Will The ECB Continue To Hike Rates?
  • 1,008 days Forbes: Aramco Remains Largest Company In The Middle East
  • 1,009 days Caltech Scientists Succesfully Beam Back Solar Power From Space
  • 1,409 days Could Crypto Overtake Traditional Investment?
  • 1,414 days Americans Still Quitting Jobs At Record Pace
  • 1,416 days FinTech Startups Tapping VC Money for ‘Immigrant Banking’
  • 1,419 days Is The Dollar Too Strong?
  • 1,419 days Big Tech Disappoints Investors on Earnings Calls
  • 1,420 days Fear And Celebration On Twitter as Musk Takes The Reins
  • 1,422 days China Is Quietly Trying To Distance Itself From Russia
  • 1,422 days Tech and Internet Giants’ Earnings In Focus After Netflix’s Stinker
  • 1,426 days Crypto Investors Won Big In 2021
  • 1,426 days The ‘Metaverse’ Economy Could be Worth $13 Trillion By 2030
  • 1,427 days Food Prices Are Skyrocketing As Putin’s War Persists
  • 1,429 days Pentagon Resignations Illustrate Our ‘Commercial’ Defense Dilemma
  • 1,430 days US Banks Shrug off Nearly $15 Billion In Russian Write-Offs
  • 1,433 days Cannabis Stocks in Holding Pattern Despite Positive Momentum
  • 1,434 days Is Musk A Bastion Of Free Speech Or Will His Absolutist Stance Backfire?
  • 1,434 days Two ETFs That Could Hedge Against Extreme Market Volatility
  • 1,436 days Are NFTs About To Take Over Gaming?
What's Behind The Global EV Sales Slowdown?

What's Behind The Global EV Sales Slowdown?

An economic slowdown in many…

Strong U.S. Dollar Weighs On Blue Chip Earnings

Strong U.S. Dollar Weighs On Blue Chip Earnings

Earnings season is well underway,…

  1. Home
  2. Markets
  3. Other

Elliott Wave Analysis On SP500 And USDJPY

S&P500

US stocks turned sharply up on Friday, which confirms the fact that bullish price action is still in play as all of the losses that occurred after ECB on Thursday were erased. But despite strong recovery from 2039 we don't think that uptrend will continue straight up to 2120. Based on the latest wave structure, we assume that new minor corrective retracement will occur, which can be wave E of a triangle in wave 4). Ideally this leg will retrace back to 2055/2060 area before uptrend may continue.

S&P500, 1H

S&P 500 Elliott Wave 1-Hour Chart


USDJPY

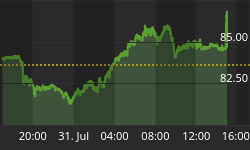
No change on USDJPY in the last few hours; price is still looking bullish since Friday when market gave us signs of a completed triangle at 122.29. As such, we expect more upside this week, ideally towards 124.50, but we may see a new correction to 123.10 before highs around 123.70 can be finally taken out. However, sooner or later break out from a 160 pip range will occur, while 122.29 support holds.

USDJPY, 30 Min

USDJPY Elliott Wave 30-Minute Chart


If you like our trading analysis, you can visit our website at --> www.ew-forecast.com


Back to homepage

Leave a comment

Leave a comment