• 751 days Will The ECB Continue To Hike Rates?
  • 751 days Forbes: Aramco Remains Largest Company In The Middle East
  • 753 days Caltech Scientists Succesfully Beam Back Solar Power From Space
  • 1,153 days Could Crypto Overtake Traditional Investment?
  • 1,158 days Americans Still Quitting Jobs At Record Pace
  • 1,160 days FinTech Startups Tapping VC Money for ‘Immigrant Banking’
  • 1,163 days Is The Dollar Too Strong?
  • 1,163 days Big Tech Disappoints Investors on Earnings Calls
  • 1,164 days Fear And Celebration On Twitter as Musk Takes The Reins
  • 1,166 days China Is Quietly Trying To Distance Itself From Russia
  • 1,166 days Tech and Internet Giants’ Earnings In Focus After Netflix’s Stinker
  • 1,170 days Crypto Investors Won Big In 2021
  • 1,170 days The ‘Metaverse’ Economy Could be Worth $13 Trillion By 2030
  • 1,171 days Food Prices Are Skyrocketing As Putin’s War Persists
  • 1,173 days Pentagon Resignations Illustrate Our ‘Commercial’ Defense Dilemma
  • 1,174 days US Banks Shrug off Nearly $15 Billion In Russian Write-Offs
  • 1,177 days Cannabis Stocks in Holding Pattern Despite Positive Momentum
  • 1,178 days Is Musk A Bastion Of Free Speech Or Will His Absolutist Stance Backfire?
  • 1,178 days Two ETFs That Could Hedge Against Extreme Market Volatility
  • 1,180 days Are NFTs About To Take Over Gaming?
Another Retail Giant Bites The Dust

Another Retail Giant Bites The Dust

Forever 21 filed for Chapter…

The Problem With Modern Monetary Theory

The Problem With Modern Monetary Theory

Modern monetary theory has been…

  1. Home
  2. Markets
  3. Other

Elliott Wave Analysis On AUDJPY And GBPCAD

AUDJPY

AUDJPY is in pullback mode and it seems as a possible flat 3-3-5 corrective structure. The last part of our flat will ideally unfold in five waves and continue towards 88.20-88.8 area. This is an interesting pair to look for shorts in coming weeks since we also see AUDUSD trading in final stages of a correction.
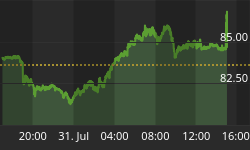
AUDJPY, 1H

AUDJPY 1-Hour Elliott Wave Chart


GBPCAD

On the 4h chart of GBPCAD, we can also see pair trading in a pull-back structure, possibly in the last leg of a three wave correction in blue wave (ii). Ideally price will continue to the downside, where our upper channel line can react as a support. If our view is correct more gains can be expected next week.

GBPCAD, 4H

GBPCAD 4-Hour Elliott Wave Chart


If you like our trading analysis, you can visit our website at --> www.ew-forecast.com


Back to homepage

Leave a comment

Leave a comment