Sellers took vacation last week and the program driven "short squeeze" rally triggered three consecutive days of triple-digit gains in the DOW Industrials. As seen in the updated chart below, the surge in equities boosted the S&P 500 index into positive territory for the year. The Nasdaq index has been in the black since September, but the other major indexes are still in the red year-to-date. Precious metals remain the biggest loser with gold in bear market territory down 22% for the year. For the week, the Benchmark S&P 500 Index and Blue Chip Dow Jones Industrial Average jumped 2.90% and 2.80% respectively. The Nasdaq rose 2.50% for the week and Russell 2000 gained 2.7%.

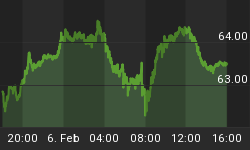
The CBOE Volatility Index (VIX) is known as the market's "fear gauge" because it tracks the expected volatility priced into short-term S&P 500 Index options. When stocks stumble, the uptick in volatility and the demand for index put options tends to drive up the price of options premiums and sends VIX higher. You can see in the chart below how volatility index crashed 24% during the holiday-shortened week as equities surged. Our recent analysis played out as advertised when we said, "...Similar to what happened in August, if the VIX tops out after the FOMC decision and option expiration...volatility should subside as stock prices recover going into year-end..." The chart shows the volatility index is currently down near its $15 support level that has been in place the entire fourth quarter.

Market Outlook
Last week's analysis mentioned "...With traders starting to take holiday sabbaticals the next few weeks trading volume should be lighter than normal. This provides an opportunity for the stock market to recover as it normally does going into year-end because market moves can be exaggerated on lighter volume..." While many traders started vacationing last week, algorithmic trading kicked in to start the "Santa Claus" rally during the abbreviated trading week. After the melodrama about whether the Fed would raise interest ended, the net result is that interest rates are still near historically low levels. Low rates are typically bullish for the stock market and as we head into "the best six months of the year" for stocks, there is no reason this trend won't hold up. The U.S. economy continues to chug along and stocks remain the best game in town. You can see in the graph below how the major equity indexes have had a scorching fourth-quarter. The biggest near term threat to the stock market will be quarterly earnings results when they are reported early next year. If fourth-quarter earnings disappoint, this might panic investors into believing the economy is weaker than they thought and spark the next market sell off.

Trading Strategy
Last week we noted "...the week after December triple-witching option expiration, which has a historically bullish record..." As reported by Jeff Hirsh in the Almanac Trader, the three trading days following the Christmas holiday break, also has a bullish track record over the past 31 years. These three days also rank near the top when compared to all other market holidays. Average and median gains across DJIA, S&P 500, NASDAQ and Russell 2000 are fairly stable and consistent on each of the days following the Christmas holiday. We have been on the sidelines the past few weeks waiting to see how traders responded to the recent Fed rate decision. Our preference is to try avoiding unnecessary risks when setting up trades and it was important to let the market provide direction after the first rate increase in almost a decade. Yearend tax loss selling appears to be over where investors sell off losing positions to offset stock gains and other income, which is why the market is moving higher on lower volume. In the graph below, Consumer Staples and Health Care are the best performing sectors over the past month and these groups can be expected to be among the leaders going into the New Year. Bidding on stocks in the leading groups should be a good bet to start the year.

Feel free to contact me with questions,


