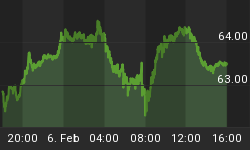
An Apple A Day
Apple (AAPL) is due to report earnings after the bell Tuesday. Wall Street is known for lowering expectations prior to earnings in order to paint a more favorable picture of the actual results. Investors will have the hard numbers in hand in a few hours. From MarketWatch:
Analysts surveyed by FactSet expect Apple to just barely set a new iPhone sales record of 75 million, though that would mark a year-over-year improvement of just one million, versus much higher growth rates in the past. Morgan Stanley told investors in a note on Tuesday that they should brace for the first year-over-year sales decline for the iPhone since its 2007 launch.
Trends Speak To Economic Conviction
When the net aggregate opinion of all market participants is favorable, markets tend to push higher. Conversely, when the net aggregate opinion becomes pessimistic, markets tend to drop. Moving averages help us monitor the market's pulse. During a correction, the S&P 500 (shown in black below) tends to drop below the colored moving averages. Also note the slopes of the colored moving averages (MAs) tend to roll over during sharper pullbacks in equity prices. The bullish period on the right side of the chart looks quite a bit different (price above MAs, slopes of MAs are positive).

How Does The Same Chart Look Today?
Even with the S&P 500 up 23 points during Tuesday's session, the slopes of the moving averages are all negative, which is indicative of a bearish trend. Our interest in stocks would increase if the chart below can morph into something similar to the right side of the 1990-1991 chart above.

Investment Implications - The Weight of The Evidence
As noted in this week's video, the concerning evidence is starting to spill over into longer timeframes. The hard data in hand continues to lean toward bonds (IEF) and cash, relative to equities. With a Federal Reserve statement coming Wednesday at 2:00 pm, it is prudent to keep an open mind about all outcomes, while respecting the market's current waning risk-reward profile.


