


The following article was originally published at www.theagiletrader.com on October 30, 2005.
WEEKLY WRAP-UP
Dear Speculators,
I have had a remarkable weekend reading up on the economy, the stock market, the appointment of incoming Fed Chairman Bernanke, and the indictment of I. Lewis Libby. It seems to me that there has rarely been a time when just about everyone disagrees with almost everyone else more vehemently.
Just to summarize the polarities, and in no particular order:
- The Libby indictments are either secondary (or tertiary) and trivial charges or else the tip of the corruption iceberg, depending on who's opining (Republican or Democrat).
- Bernanke is either the perfect choice or a catastrophe in the making, depending on your view of what the Fed's job IS and what it SHOULD BE, as well as your view of if/when depleted national savings, the outsized current account deficit, and the historic credit bubble will smack the economy in the back of the head.
- Inflation is either ramping up or quieting down, depending on whether you look at 3Q05's Core or Headline PCE Deflator.
- The stock market is either poised for a year-end rally or a sharp decline, depending on whether you look at historic seasonality of the Michigan Consumer Sentiment Survey.
As for the first 2 bullet points above (Libby and Bernanke) I will withhold opinion because the last thing you need is my opinion on those subjects. As for the latter 2 bullet points I will offer some quantitative study, as they may be illuminating.
In Friday morning's Preliminary GDP Report (subject to 2 monthly revisions going forward) Headline Q/Q Annualized Inflation jumped up from +2.6% to +3.1% (pink line in the chart below).

That puts the pink line in the 52 nd percentile of all quarterly readings over the past 45 years, well up from the recent nadir at +1.1% in early '03.
Meanwhile, however, the Core Q/Q Annualized Inflation rate dropped from +1.7% to +1.3%, now in the 12 th percentile of all readings over the past 45 years, barely above its cycle low of +0.9% in mid '00.
Is inflation creeping up to "average" or "above average" levels? Or is it still bouncing along the bottom?
The Non Core categories (those omitted from the Core PCE Deflator) are Food and Energy. But the issue isn't particularly food; while beef and coffee may be a bit high right now, grains and the like are in the main no more expensive than they have been over the past 5 years - and in REAL terms they're CHEAPER. Indeed the secular trend is for consumers to pay a diminishing share of disposable income on what we eat.
The disparity between Headline and Core Inflation, and whether the cost of living for the consumer is going to accelerate or not, boils down to the cost of Energy So, unfortunately, I'm going to have to harp on the same-o same-o: the cyclical fate of the economy and the cyclical fate of the stock market hinge on what happens with cost of Energy.
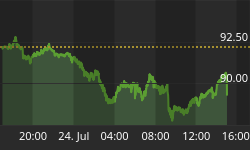
Crude Oil continues its mid-term retrenchment phase with key price support in the $58-$60 band.

The December futures contract for Crude has essentially been consolidating for the past 8 trading days. We continue to watch $58 and anticipate that a break below that level could provoke a decline to $52. On a longer-term basis, if $58 breaks, then we have a pretty sizable Head & Shoulders Top formation in place, which would project a low in the $45-$46 area. But that kind of action could well require that Crude first bounce in the $58-$64 band as it forms a more complex Right Shoulders.
**** **** ****
WEEKLY ECONOMIC NEWS DIFFUSION INDEX (WENDI)
For those of you who are new to our Weekly Wrap-up our WENDI work entails reviewing the prior week's major economic reports. We assign each report a value anywhere between -1 and +1 in half-point increments. So, a very bearish report would get a -1, a very bullish report would get a +1, and, say, a qualifiedly bullish report would get a +0.5. We then sum the individual scores, divide by the total number of reports, and multiply that quotient by 100 to derive the Weekly WENDI, which is expressed as a percentage of anywhere between -100% and +100% (the former being maximally bearish and the latter being maximally bullish).
The Cumulative Weighted WENDI is the running sum of the individual scores. And the 4-Wk Weighted WENDI is the sum of the past 4 weeks' individual scores divided by the total number of reports over the same period, and it tells us about the momentum in the flow of economic news.

Last week the Weekly WENDI (black line) dropped from +15% to -9%. The 3 consumer sentiment polls led the way lower with full-on bearish (-1) readings. Also contributing to the ursine tenor of the data was the Chicago Financial Activity Index. There were no +1 readings on the week, though the GDP data was qualifiedly bullish. And many of the negative components were weakened by fallout from Hurricane Katrina, so the weakness could well be temporary.
The Cumulative Weighted WENDI (red line), down from 252 in late August to 241 last week, reveals weak downtrend in the data. And that shows up in our momentum measurement, the mildly negative 4-Wk Weighted WENDI (blue), which is at -4%.
Since the price of Oil spiked up to $70 the flow of economic news has had a negative bias despite the fact that the price of Crude has dropped back down by almost $10/barrel. Going forward we would expect WENDI to move inversely to the price of the Energy Commodities, albeit with some lag.

December Natural Gas futures are in the process of filling the September gap (yellow) in the mid $12s. And we would suspect that the August gap will be a magnet that will attract the chart toward the high $10s, if not before the winter, then in the spring.
**** **** ****
EARNINGS
The consensus for Forward 52 Week EPS on the SPX continues to surge.

All 3 EPS lines hit new all-time highs last week. And the consensus estimate is for 12.6% growth in SPX EPS over the next 52 weeks.
There's no let-up, however, in the crummy distribution of those upward revisions.

Energy companies are pretty much the only big story in terms of those revisions.
The SPX PE on F52W EPS is at 14.1, up just +0.1 off its low of last week.
The Fed's Fair Value calculation yields a target of 1862.
Our Risk Adjusted Fair Value calculation yields a target of 1315, brought down from 1343 last week on the precipitous rise of the yield on the 10-Yr Treasury from 4.39% to 4.57%.
Equity Risk Premium (the difference between the F52W Earnings Yield on the SPX and the yield on the 10-Yr Treasury) is now at 2.53%, still above the post-9/11 median of 1.9%. That puts ERP in the 88 th percentile relative to the past 45 years and in the 98 th percentile relative to the past 10 years. Relative to Treasury Notes the stock market remains inexpensive and we would expect equities to outperform both Treasuries and Corporates until the excess ERP is worked off.
**** **** ****
A LOOK DOWN THE MARKET'S THROAT
The SPX flirted with a monthly close below its 12-month moving average through much of October. However, Friday's rally pulled the index up and over that line.

As of Friday the 12-mma was at 1197.71. The SPX closed Friday at 1198.41. So, Monday will tell the tale. However, the index is now so close to the line that a one-day violation won't be terribly significant…nor will a close above that line.
The SPX has retraced about 62% of the bear-market decline (the 62% line is at 1253 and the rally high was 1245 - close enough). A move up through 1253 brings into play targets at 1291 (66.7% retracement) and 1368 (76.4% retracement). Failure to penetrated up through 1253 during the November-December time frame would be problematic for the bullish case and such a failure would get us focused on downside targets at 1161 and 1068.
Our expectation is that seasonal strength will carry the SPX up to at least the 1291 target. And if Crude breaks down, then we'll be looking for 1368.
I'll conclude this missive with an eerie chart of the SPX.

The blue line tracks the SPX's performance as it rose up off the 1990 October low prior to operation Desert Storm. The red line tracks the SPX's performance as it rose up off the 2002's October low prior to the more recent Iraq Incursion. As of Trading Day # 772 the red line is up +54%. As of Trading Day #772 the blue line was up +57%. The correlation between the 2 lines is +0.896 (+1 is perfect and -1 is perfectly inverse).
Despite the disheartening dissimilarities between the outcomes of the 2 wars (not to mention the price of Oil) these 2 lines displaying startling similarity. If the analogue holds (and it could break at any time) the market top will come in early February.
A sharp decline followed by a choppy trading range is what followed the February top in early '94. And that doesn't look like a bad paradigm to keep in mind as we head into '06.
Best regards and good trading!


