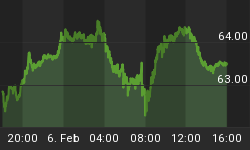
A "rally" attempt is underway. Stocks are continuing to rebound and all is well with the World? Or is it? With each passing day, the United States plummets deeper and deeper into a "black hole" of debt, of which it will be almost impossible to repay. At the time, of this writing the national debt is $18,939,663,109,937!
To put this into perspective, the national debt is so bad that if every citizen (including children) were to help pay it off, each one of us would have to contribute $58,652.00.
In the last couple of weeks, I have informed you of this "rebound" in the US Markets. Yesterday, February 2nd, 2016, a sharp fall in the markets was recorded.
Major support levels have held, perhaps slightly bent last month, but they did not break. Major support level of the SPX is 1880. If this support is breached, it may drop to 1861 before it rebounds. I do not see the SPX sustaining below 1880.
Markets are once again expected to bounce back.

I still have a bullish bias for the market, in fact if my analysis is correct it could last until March 24th.
But if we do get more downside from this current level it would create another wave of "Panic Selling" and we must hold above the low of January 20th, 2016 or it may be the start of the next bear market for large-cap stocks sooner than later.
The U.S, Stock Markets have not reacted to any bad news, as of yet. The markets are at their fourth highest level of valuation, in history, according to the Shiller P/E Model. Professor Robert Shiller, of Yale University, invented the Schiller P/E to measure the markets' valuation. The Schiller P/E is a more reasonable market valuation indicator than the P/E ratio, because it eliminates fluctuations of the ratio, caused by the variation of profit margins, during business cycles. There are only three other periods, in time, that these ratios occurred (1929, 2000, 2007) in with we measured similar readings when the market topped or should I say triggered market crashes and multi-year bear markets...

Short term I'm still bullish but the longer-term bias remains firmly BEARISH!
Get My Trading Forecasts and Trade Signals Today.
Make 2016 Winning A Wining Year For Your Trading Account: www.TheGoldAndOilGuy.com


