• 722 days Will The ECB Continue To Hike Rates?
  • 722 days Forbes: Aramco Remains Largest Company In The Middle East
  • 724 days Caltech Scientists Succesfully Beam Back Solar Power From Space
  • 1,124 days Could Crypto Overtake Traditional Investment?
  • 1,129 days Americans Still Quitting Jobs At Record Pace
  • 1,131 days FinTech Startups Tapping VC Money for ‘Immigrant Banking’
  • 1,134 days Is The Dollar Too Strong?
  • 1,134 days Big Tech Disappoints Investors on Earnings Calls
  • 1,135 days Fear And Celebration On Twitter as Musk Takes The Reins
  • 1,137 days China Is Quietly Trying To Distance Itself From Russia
  • 1,137 days Tech and Internet Giants’ Earnings In Focus After Netflix’s Stinker
  • 1,141 days Crypto Investors Won Big In 2021
  • 1,141 days The ‘Metaverse’ Economy Could be Worth $13 Trillion By 2030
  • 1,142 days Food Prices Are Skyrocketing As Putin’s War Persists
  • 1,144 days Pentagon Resignations Illustrate Our ‘Commercial’ Defense Dilemma
  • 1,145 days US Banks Shrug off Nearly $15 Billion In Russian Write-Offs
  • 1,148 days Cannabis Stocks in Holding Pattern Despite Positive Momentum
  • 1,149 days Is Musk A Bastion Of Free Speech Or Will His Absolutist Stance Backfire?
  • 1,149 days Two ETFs That Could Hedge Against Extreme Market Volatility
  • 1,151 days Are NFTs About To Take Over Gaming?
How The Ultra-Wealthy Are Using Art To Dodge Taxes

How The Ultra-Wealthy Are Using Art To Dodge Taxes

More freeports open around the…

Zombie Foreclosures On The Rise In The U.S.

Zombie Foreclosures On The Rise In The U.S.

During the quarter there were…

The Problem With Modern Monetary Theory

The Problem With Modern Monetary Theory

Modern monetary theory has been…

  1. Home
  2. Markets
  3. Other

Elliott Wave Analysis On EURGBP And USDJPY

EURGBP

For now, we have seen some nice turn down, but still not enough for a "top in place". We would love to see push beneath 0.770 that would then suggests more weakness next week with minimum three wave decline.

EURGBP, 4H

EURGBP 4-Hour Chart


USDJPY

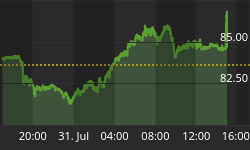
A decline on USDJPY has extended to a new low and is falling very sharply from 115.23 so looks like that wave v-circled is going to be extended fifth wave headed down to 110 area. Despite very strong bearish momentum we think that leg down from 121.68 still can be wave C as part of a complex corrective pattern. However, we need a completed bearish pattern first, and then look for possible bullish reversal structure with five waves.

USDJPY, 4H

USDJPY 4-Hour Chart


If you like our trading analysis, you can visit our website at --> www.ew-forecast.com


Back to homepage

Leave a comment

Leave a comment